
Tezos Price Analysis XTZ / USD: Battlefield
There's an ongoing battle for the control of XTZ's price.
- Tezos gives back recent trading gains and trades down nearly ten percent
- Short-term technical analysis shows a bearish head and shoulders pattern
- The daily time frame shows a large inverted head and shoulders pattern
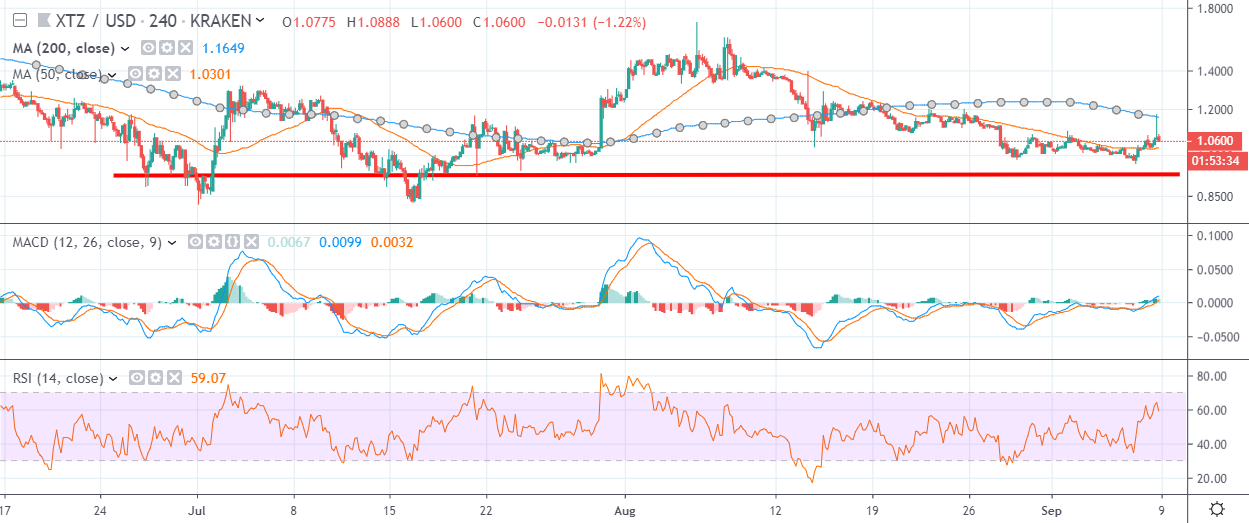
Tezos is coming under pressure in early week trading after giving back its recent trading gains and falling by over ten percent from its current monthly trading high. Bulls failed to overcome the XTZ / USD pair’s 200-day moving average during the latest advance, causing bears to move in from the just below the 1.18 level.
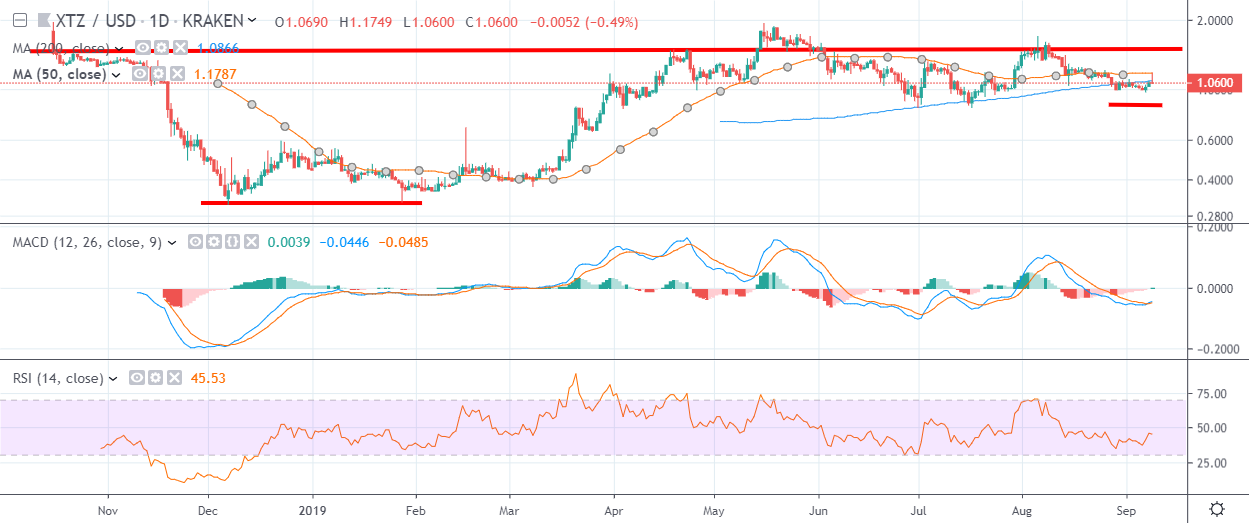
Tezos has been a notable underperformer in the altcoin space, having lost nearly forty-five percent of its value from its 2019 trading peak. Tezos shows tremendous upside potential on the larger time frames, although the lower time frames suggest that the XTZ / USD pair would need to rally by some thirty-seven percent to move the cryptocurrency away from danger in the near-term.
The lower time frames continue to show a bearish head and shoulders pattern with a significant downside potential, with bulls needing to rally the XTZ / USD pair towards the $1.70 price region to negate the bearish pattern. Tezos currently trades just above the 1.05 level.
The daily and weekly time frames both show a large inverted head and shoulders pattern, which if triggered would see the XTZ / USD pair soar in value. In fact, the bullish pattern projects a $1.70 upside move if bulls can move price above the $2.00 level.
In the immediate term, XTZ / USD traders are battling for control around the 1.00 level, which is a key psychological area. The four-hour time frame highlights that if bulls can defend the $0.92 region, further upside towards the peaks of 2019 is possible.
According to the latest sentiment data from TheTIE.io, the short-term sentiment towards Tezos is neutral, at 54.00 %, while the overall long-term sentiment towards the cryptocurrency is slightly better, at 57.00%.
Upside Potential
The four-hour time frame is showing that the XTZ / USD pair faces heavy resistance from the $1.17 to 1.18 area. This a key confluence area of short and medium-term technical resistance area which bulls will have to overcome.
The daily time frame highlights that once above the $1.18 level, the cryptocurrency has limited technical resistance until the $1.40 level.
Downside Potential
The four-hour time frame shows that if sellers start to move price below the $0.92 level then the XTZ / USD pair could come under severe selling pressure.
The mentioned time frame continues to show a large head and shoulders pattern, which should be closely monitored, particularly if price starts to drop below the neckline of the bearish pattern.
Summary
Short-term technical analysis suggests that XTZ / USD bulls and bears are still undergoing a battle for short-term control around the $1.00 technical region.
Overall, traders should watch for a breakout between the $0.92 to $1.18 trading band, with medium-term analysis currently favoring an eventual bullish breakout.
Check out what Tezos is baking in our coin guide.