
Tezos Price Analysis XTZ / USD: Entering The Arena
XTZ rises on Coinbase announcement.
- Tezos has a bullish short-term bias, with the XTZ / USD pair recovering above its 200-period moving average on the four-hour time frame
- The four-hour time frame highlights that a bullish pattern is starting to take shape
- The daily time frame continues to show a large head and shoulders pattern
Fundamental Analysis
Tezos spiked after Coinbase Pro announced that it will be launching XTZ on its platform. The coin will be tradeable in all jurisdictions supported by Coinbase, with the exception of New York State. This will add liquidity to the project and expand the number of potential investors and users.
Tezos / USD Short-term price analysis
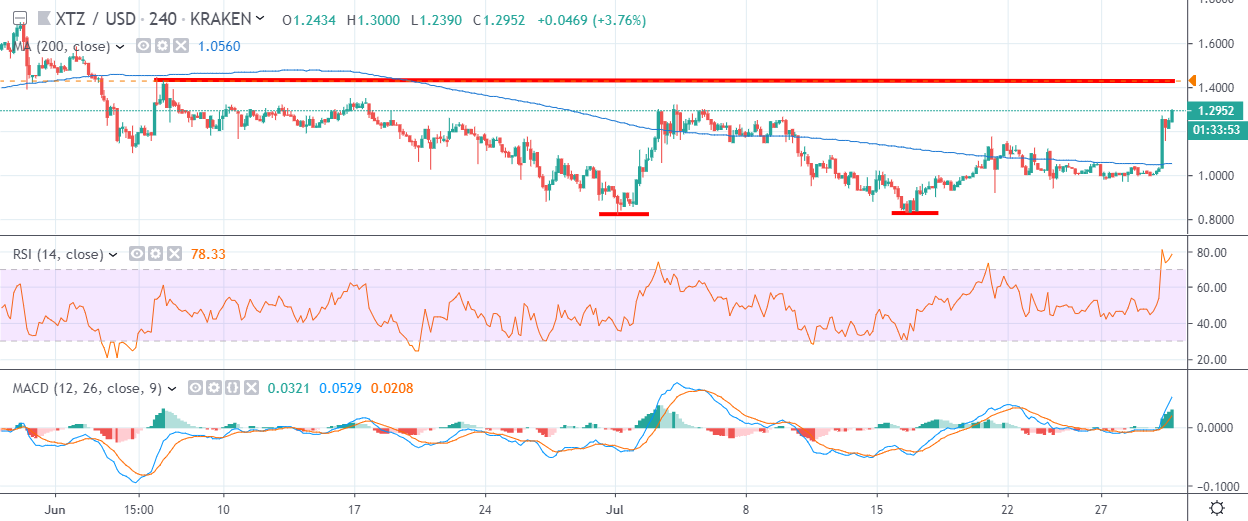
Tezos has a bullish short-term bias, with the XTZ / USD pair recovering back above its 200-period moving average on the four-hour time frame.
The four-hour time frame shows that a bullish inverted head and shoulders pattern may start to form, following the recent strong upside recovery.
Technical indicators are bullish on the four-hour time frame and continue to issue buy signals.
Pattern Watch
Traders should note that a bullish double-bottom formation is also in play across the four-hour time frame.
Relative Strength Index
The RSI indicator remains bullish on the four-hour time frame, although it has reached overbought conditions.
MACD Indicator
The MACD indicator is bullish on the four-hour time frame and continues to generate a strong buy signal.
Tezos / USD Medium-term price analysis
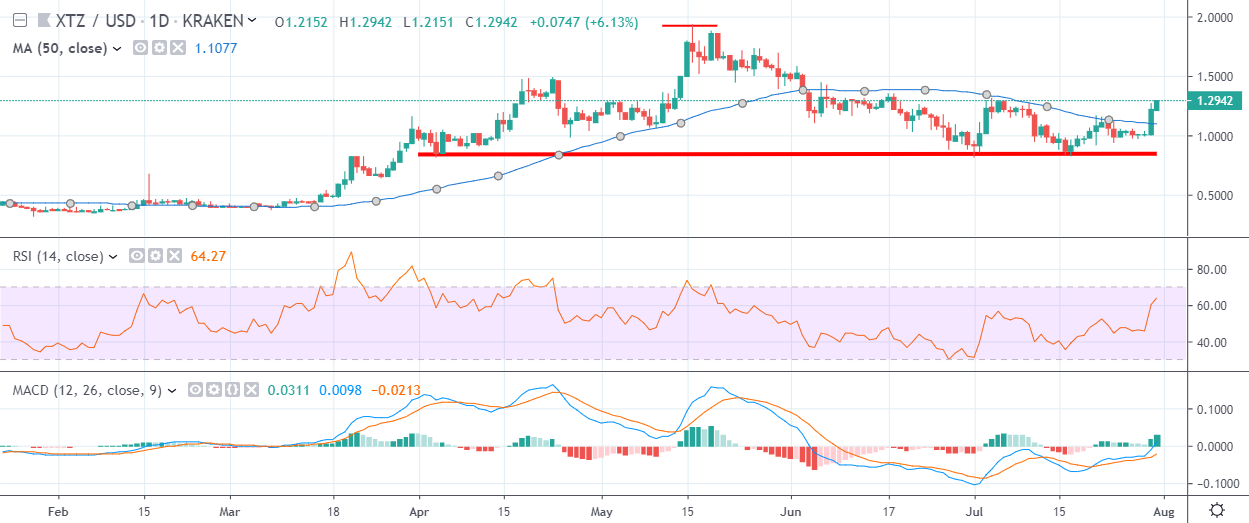
Tezos has a bullish medium-term trading bias, with the XTZ / USD pair starting to recover above its key 50-day moving average.
The daily time frame shows that a valid head and shoulders pattern remains in play, with medium-term XTZ / USD bulls working hard to invalidate the bearish pattern.
Technical indicators on the daily time frame are bullish and continue to issue strong buy signals.
Pattern Watch
Traders should note that a complex head and shoulders pattern may be forming on the daily time frame.
Relative Strength Index
The Relative Strength indicator has recovered above neutral on the daily time frame and is now issuing a buy signal.
MACD Indicator
The MACD indicator on the daily time frame is bullish and continues to generate a buy trading signal.
Conclusion
Tezos has staged a stunning upside recovery in the short-term, which may help to form an extremely large bullish pattern on the four-hour time frame.
The daily time frame continues to highlight a valid head and shoulders pattern, which bulls need to invalidate to secure the XTZ / USD pair’s medium-term prospects.
Check out what Tezos is baking in our coin guide.