Tezos Price Analysis XTZ / USD: Jump Start
XTZ shows signs of an impressive recovery from downside trend.

Share this article
- Tezos has a bullish short-term bias, with the XTZ / USD pair recovering to its highest trading level since May 2019
- The four-hour time frame shows that bulls are trying to invalidate a bearish pattern
- The daily time frame shows that a bullish breakout is currently underway
Fundamental Analysis
XTZ spiked after Coinbase announced integration of Tezos at Coinbase.com and in the Coinbase Android and iOS apps. This should open Tezos to millions of retail investors and improve its overall liquidity and adoption.
Tezos / USD Short-term price analysis
Tezos has a bullish short-term outlook, with the XTZ / USD pair recovering to its highest trading level since May 2019.
The four-hour time frame shows that bulls are working hard to negate a head and shoulders pattern, although the bearish pattern remains valid.
Technical indicators have a strong bullish bias on the four-hour time frame.
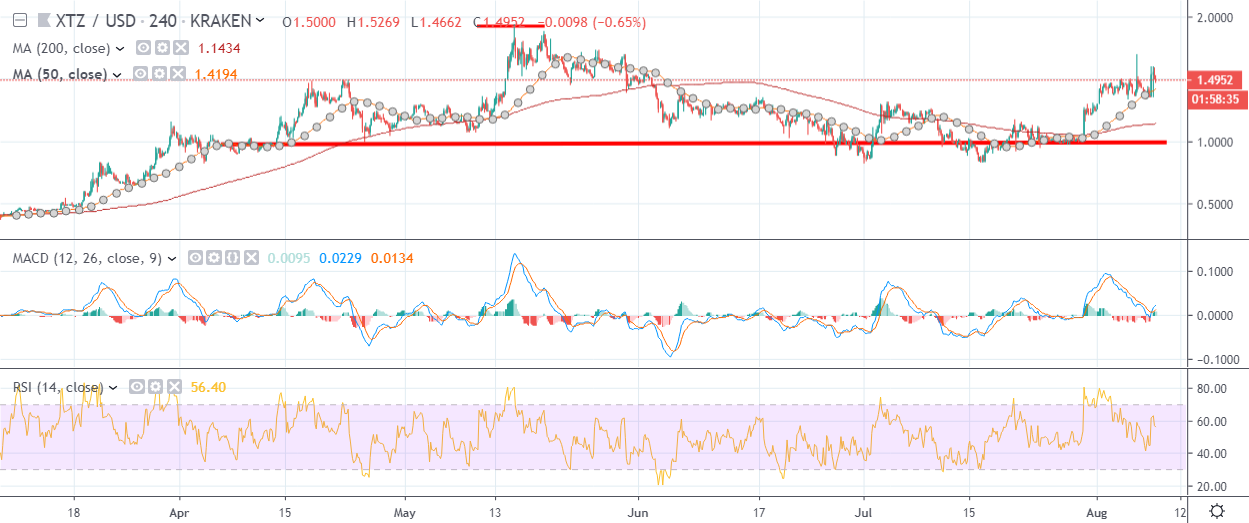
Traders should note that a bullish inverted head and shoulders pattern could start to form across the four-hour time frame if the recent recovery continues.
Relative Strength Index
The RSI indicator remains bullish on the four-hour time frame and shows scope for further upside.
MACD Indicator
The MACD indicator is rising on the four-hour time frame and continues to issue a buy signal.
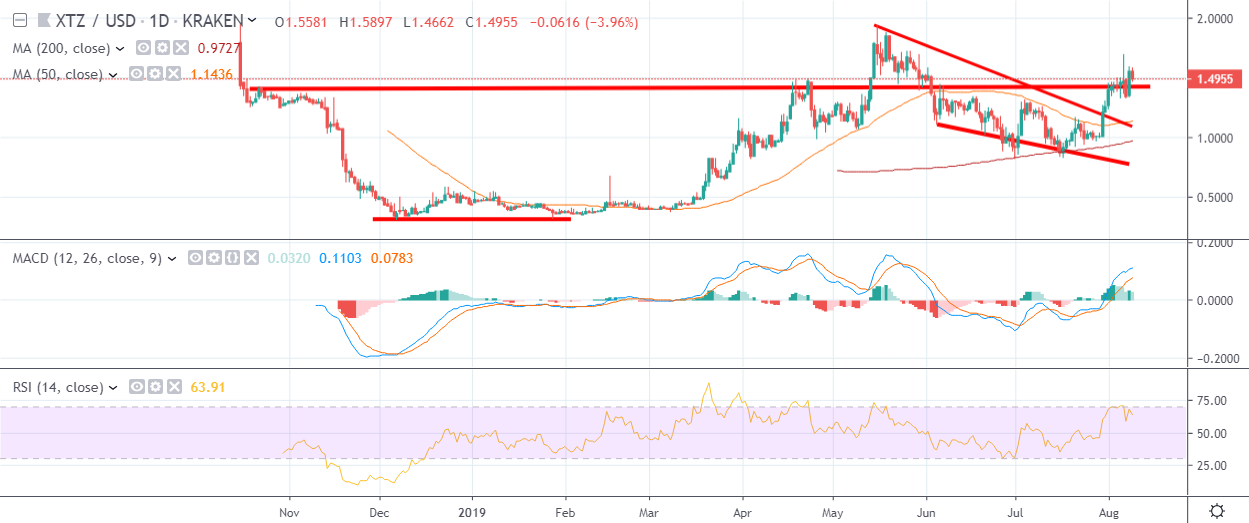
Tezos / USD Medium-term price analysis
Tezos has a bullish medium-term trading bias, with the XTZ / USD pair starting to recover above its key 200-day moving average.
The daily time frame shows that the XTZ / USD pair has moved back above the neckline of a large inverted head and shoulders pattern, following an upside breakout from a falling wedge pattern.
Technical indicators on the daily time frame are bullish and continue to issue buy signals.
Pattern Watch
Traders should note that he XTZ / USD pair could soar to a new all-time price high if the inverted head and shoulders pattern on the daily time frame is triggered.
Relative Strength Index
The Relative Strength Index on the daily time frame remains bullish, although it is approaching overbought territory.
MACD Indicator
The MACD indicator on the daily time frame is bullish and continues to generate a buy trading signal.
Conclusion
Tezos bulls have staged another impressive recovery and are currently attempting to invalidate a bearish pattern on the four-hour time frame.
The daily time frame highlights that the XTZ / USD pair could rally to a fresh all-time price high if bulls can maintain the recent upside momentum.
Check out what Tezos is baking in our coin guide.
Share this article
