
Tezos Price Analysis XTZ / USD: Not Giving Up
Despite losing all its monthly gains, XTZ's outlook remains relatively positive.
- Tezos has a bearish short-term bias, with the XTZ / USD pair erasing all its monthly gains
- The four-hour time frame shows that the bearish head and shoulders pattern has now reached its full downside projection
- The daily time frame shows that the XTZ / USD pair has found strong technical support from its 200-day moving average
Tezos/USD Short-term price analysis
Tezos has a bearish short-term outlook, with the XTZ / USD pair moving below key support and eroding all its monthly trading gains.
The four-hour time frame shows that the bearish head and shoulders pattern has now reached its overall downside potential. The XTZ / USD pair is also struggling to move above its 200-period moving average on the mentioned time frame.
Technical indicators across the four-hour time frame are attempting to move higher.
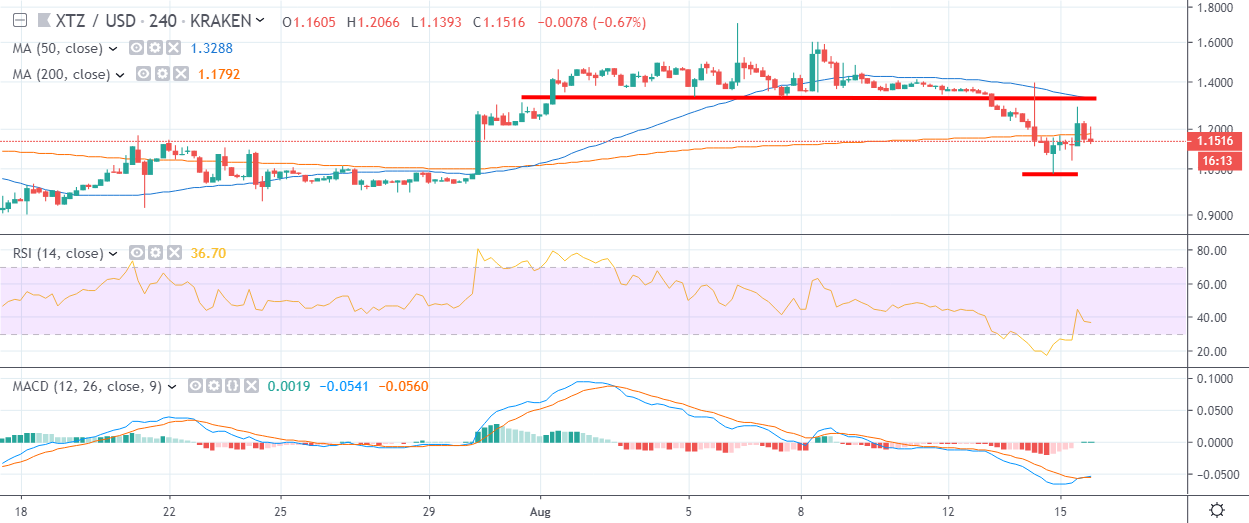
Pattern Watch
Traders should note that a bullish inverted head and shoulders pattern could start to form across the four-hour time frame.
Relative Strength Index
The RSI indicator is attempting to recover higher, although it remains technically bearish on the four-hour time.
MACD Indicator
The MACD indicator is rising on the four-hour time frame, although the buy signal is still weak.
Tezos/USD Medium-term price analysis
Tezos has a bullish medium-term trading bias, with the XTZ / USD pair bouncing sharply form key technical support on the daily time frame.
The daily time frame shows that the XTZ / USD pair is attempting to recover higher after bouncing from dual technical support from a falling wedge pattern and its 200-day moving average.
Technical indicators on the daily time frame are bearish and continue to issue sell signals.
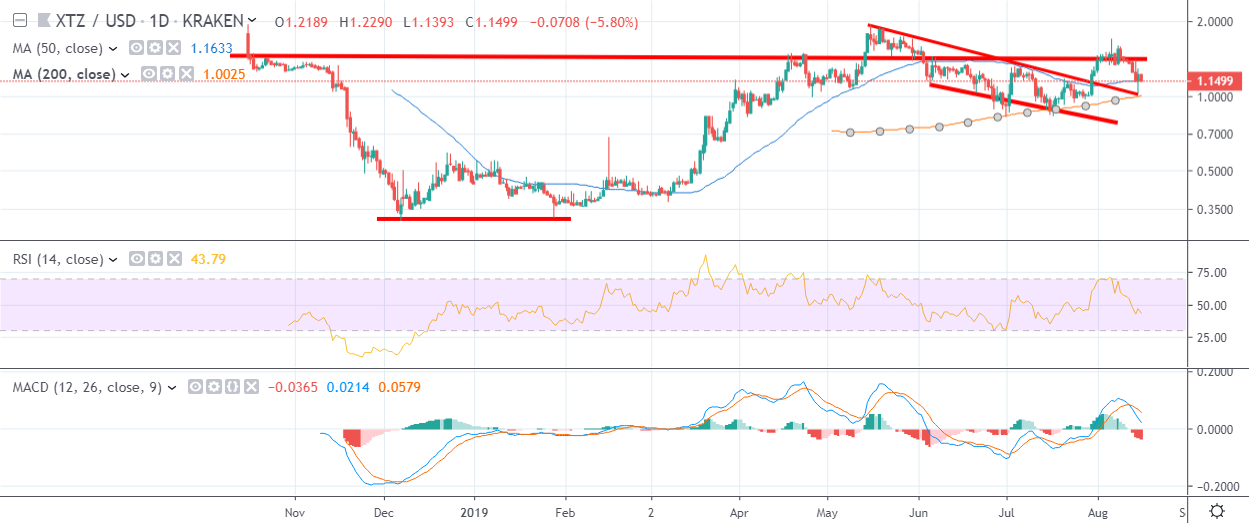
Pattern Watch
Traders should note that a large inverted head and shoulders pattern is still present on the daily time frame.
Relative Strength Index
The Relative Strength Index on the daily time frame remains bearish and shows scope for further downside.
MACD Indicator
The MACD indicator on the daily time frame is bearish and continues to issue a strong sell signal.
Conclusion
Tezos has given back all its monthly gains as market pressures and the bearish pattern on the four-hour time frame forced the XTZ / USD pair lower.
Despite the recent decline, the cryptocurrency still has a bullish medium-term bias and appears relatively well-supported above its key 200-day moving average.
Check out what Tezos is baking in our coin guide.