 Earn with Nexo

Tezos / USD Technical Analysis: Reaching Upside Goal
While it's still looking bullish, selling pressures are increasing as the pair is exhausting its momentum.
[vc_row][vc_column][vc_column_text]
- Tezos remains bullish in the short-term, with the four-hour time frame showing an inverted head and shoulders pattern
- The daily time frame shows that the XTZ / USD pair is trapped within a bull pattern
- The XTZ / USD pair is now testing the 50 percent Fibonacci retracement of the current yearly low to the October 2018 swing-high
Tezos / USD Short-term price analysis
Tezos is bullish over the short-term, with the cryptocurrency still trading well above its 200-period moving average on the four-hour time frame.
The four-hour time frame shows an inverted head and shoulders pattern with it showing a sizeable upside projection, and also a bull flag pattern with a smaller upside target.
Technical indicators on the four-hour time frame are bullish and continue to signal further near-term gains for the XTZ / USD pair.
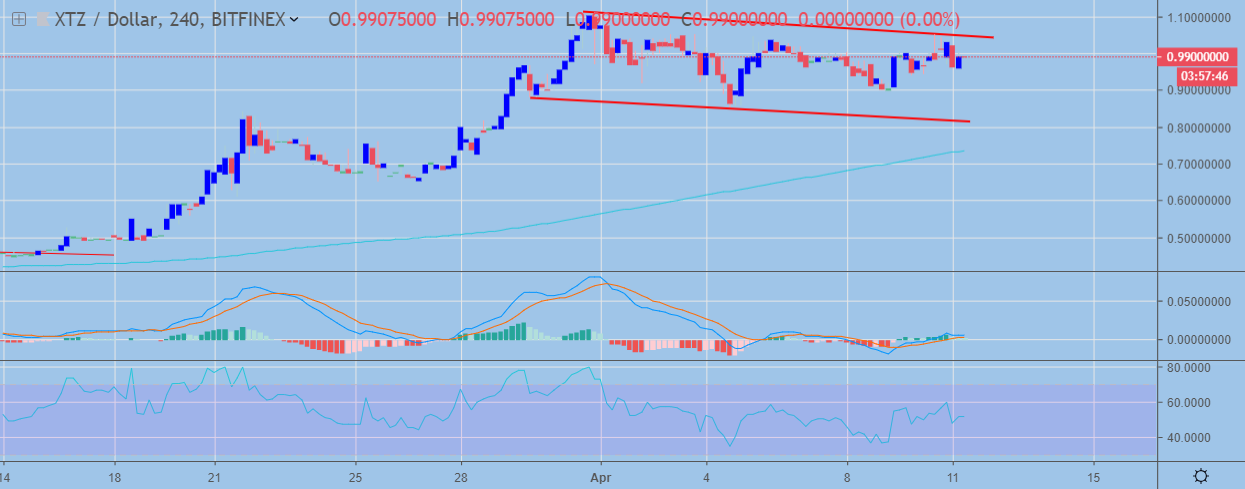 XTZ / USD H4 Chart (Source: TradingView)
Pattern Watch
Traders should note that the November 14th swing-high is the likely bullish target of the inverted head and shoulders pattern.
Relative Strength Index
The RSI indicator is also bullish on the four-hour time frame and shows scope for further upside.
MACD Indicator
The MACD indicator is bullish on the four-hour time frame and is currently generating a buy signal.
Fundamental Analysis
The recent Tezos move was triggered by the announcement that the Binance’s Trust Wallet has enabled Tezos wallet support and will soon add a native token staking feature to the Trust Wallet mobile crypto wallet app. Tezos is one of the few big blockchains that has not been listed on Binance yet.
Tezos / USD Medium-term price analysis
Tezos has a bullish medium-term outlook, with the cryptocurrency probing towards the best levels of the year so far.
However, the daily time frame shows that the bullish triangle breakout has reached its upside objective, with the XTZ / USD pair now consolidating inside a bull flag pattern.
The XTZ / USD pair is currently probing the 50 per cent Fibonacci retracement level of the current yearly low to the October swing high, while the 61.8 Fibonacci retracement level offers the strongest form of resistance above the current yearly trading high.
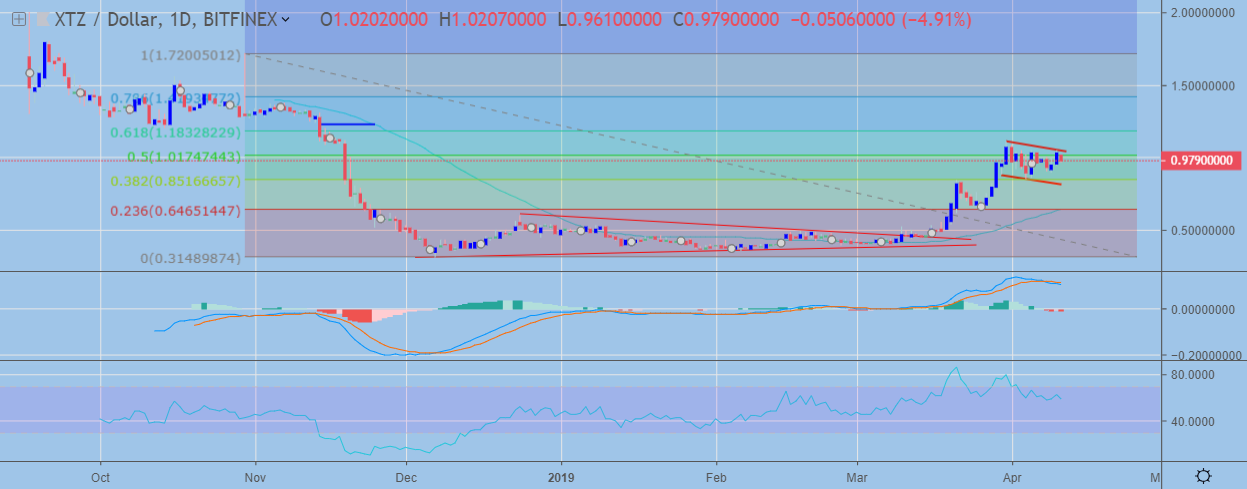 XTZ / USD Daily Chart (Source: TradingView)
Pattern Watch
Traders should note that the overall upside objective of the bull flag pattern is located slightly above the 61.8 Fibonacci retracement of the current yearly trading low to the October 2018 swing-high.
Relative Strength Index
The Relative Strength Index is also starting to turn lower as bearish pressures build on the daily time frame.
MACD Indicator
The MACD indicator on the daily time frame is starting to turn bearish.
Fundamental Analysis
Although the project has substantial financial resources, currently, it lags behind blockchain industry leaders. Its ecosystem remains small, and the medium-term outlook will depend on the project’s ability to utilize its financial resources to substantially grow its ecosystem.
Conclusion
Tezos retains a bullish short-term bias, with the presence of bullish patterns on the four-hour time frame and daily time frames pointing to further near-term upside in XTZ / USD pair.
Technical indicators on the daily time frame are showing that selling pressures are starting to build, although the overall medium-term bias still remains bullish.
Check out our coin guide for Tezos to get a quick overview of the project.
Decentral Media, Inc., the publisher of Crypto Briefing, is not an investment advisor and does not offer or provide investment advice or other financial advice. Nothing on this website constitutes, or should be relied on as, investment advice or financial advice of any kind. Specifically, none of the information on this website constitutes, or should be relied on as, a suggestion, offer, or other solicitation to engage in, or refrain from engaging in, any purchase, sale, or any other any investment-related activity with respect to any transaction. You should never make an investment decision on an investment based solely on the information on our website, and you should never interpret or otherwise rely on any of the information on this website as investment advice. We strongly recommend that you consult a licensed investment advisor or other qualified financial professional if you are seeking investment advice on an investment.
[/vc_column_text][/vc_column][/vc_row]