
Tezos / USD Technical Analysis: Second Stage Firing
The pair has reached its upside target, but it still looks bullish and could possibly trigger a second run.
- Tezos remains bullish in the short-term, with the XTZ / USD pair breaking above a triangle pattern on the four-hour time frame
- The daily time frame also shows that a bullish breakout from a triangle is underway
- The large inverted head and shoulders pattern on the daily time frame has reached its overall upside objective
Tezos / USD Short-term price analysis
Tezos has bullish short-term trading outlook, with the cryptocurrency trading at its highest level since November 16th, 2018.
A bullish breakout above a triangle pattern has occurred on the four-hour time frame, with the pattern showing scope for further upside for the XTZ / USD pair.
Technical indicators on the four-hour time frame are pointing higher and continue to issue a bullish trading signal.
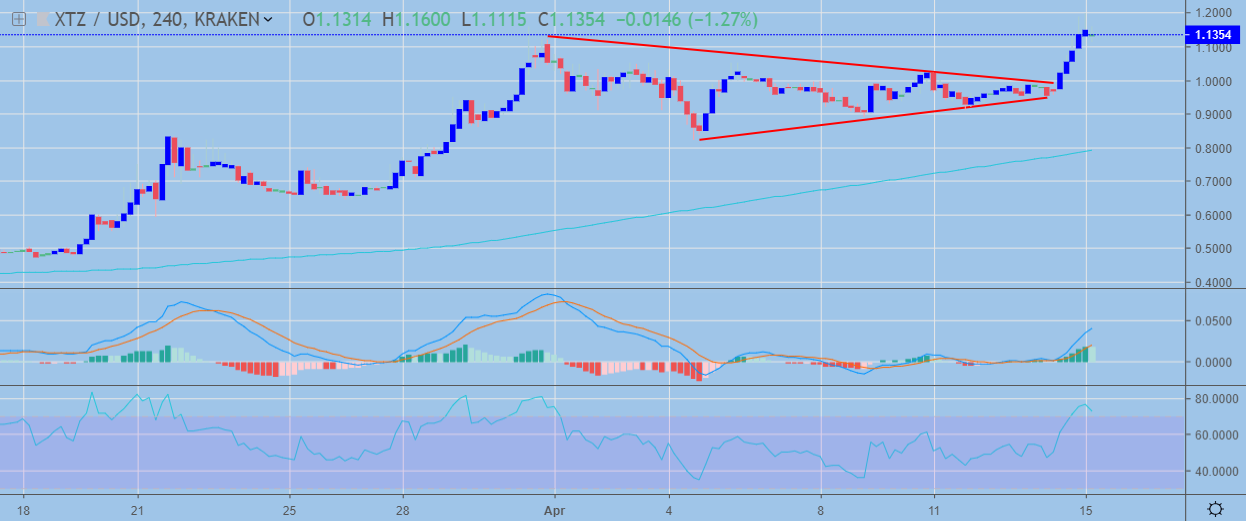 XTZ / USD H4 Chart by TradingView
Pattern Watch
With the triangle breakout in play, the November 16th, 2018 spike high currently offers the strongest form of technical resistance above.
Relative Strength Index
The RSI indicator remains bullish on the four-hour time frame, although it has reached overbought territory.
MACD Indicator
The MACD indicator remains bullish on the four-hour time frame, with the MACD signal line still offering a strong buy signal.
Tezos / USD Medium-term price analysis
Tezos has a bullish medium-term outlook, with XTZ / USD buyers currently making an attempt to close the daily candle above the former 2019 trading high.
The daily time frame shows that the bullish inverted head and shoulders pattern has reached its overall upside objective, with the recent rally in the cryptocurrency extending well beyond the pattern’s initial target.
Technical indicators across the daily time frame are starting to appear overstretched.
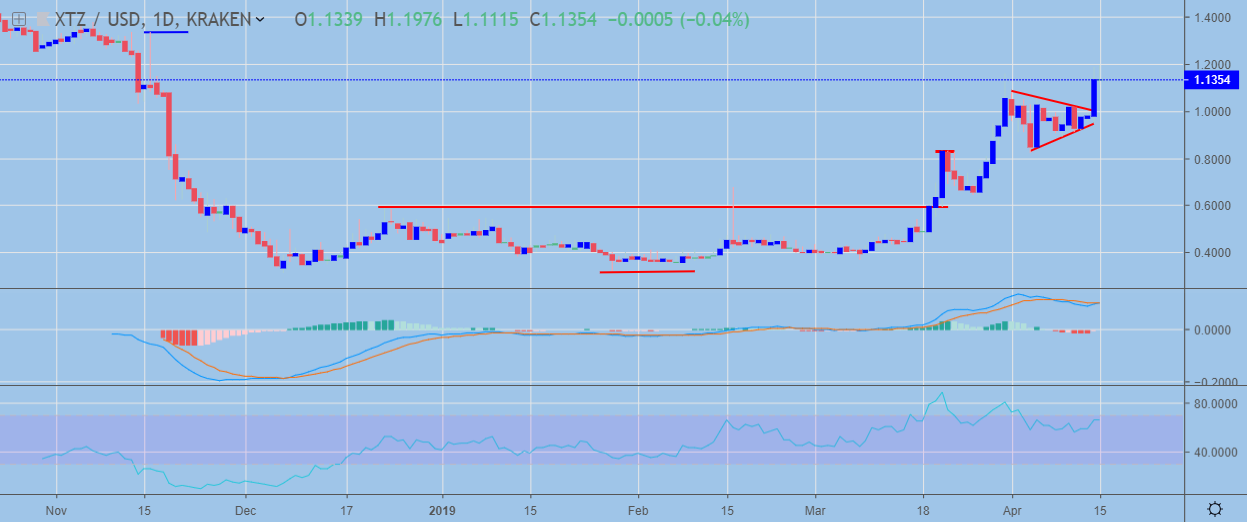 XTZ / USD Daily Chart by TradingView
Pattern Watch
Traders should note that an even larger head and shoulders pattern could form if the XTZ / USD pair moves above the November 16th swing-high.
Relative Strength Index
The Relative Strength Index is starting to turn lower on daily time frame, with bearish RSI divergence present.
MACD Indicator
The MACD indicator on the daily time frame is still generating a buy signal.
Conclusion
Tezos retains a bullish bias over both time horizons, with the daily time frame highlighting that further upside in XTZ / USD pair could create an even larger bullish pattern.
In the medium-term, the November 16th swing-high is likely to create strong technical resistance, while the RSI indicator on the daily time frame is starting to create bearish divergence.
Check out our coin guide for Tezos to get a quick overview of the project!