TRON Price Analysis TRX / USD: Retaking The Hill
TRX is attempting to recover from its losses.

Share this article
- TRON is trading back towards its monthly price open after giving back recent gains
- Short-term technical analysis suggests that the TRX / USD pair could gain nearly twenty percent in value
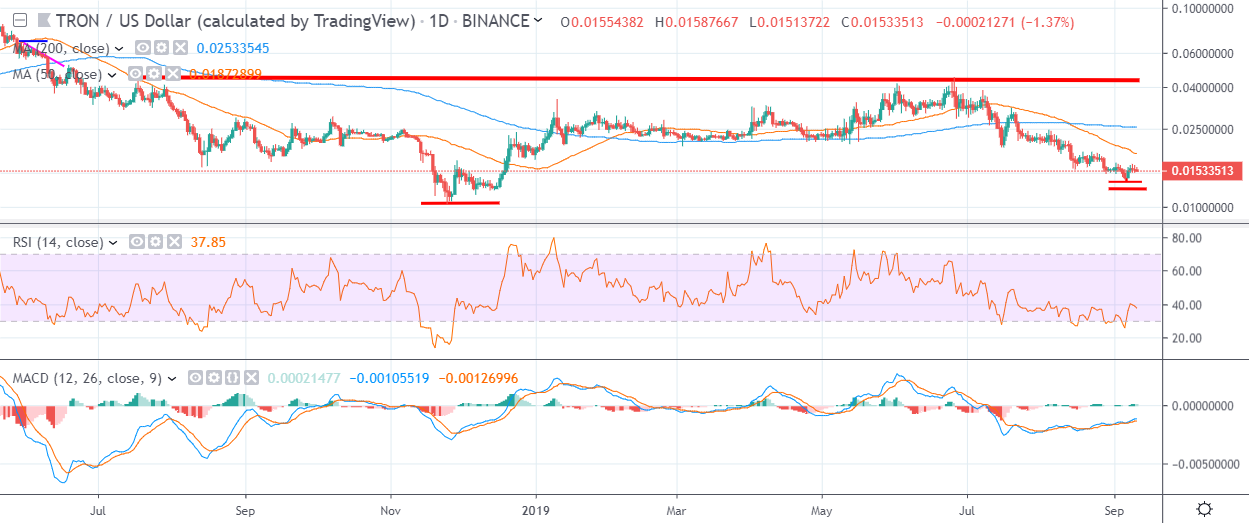
- The daily time frame highlights the $0.012400 level as the strongest form of near-term support
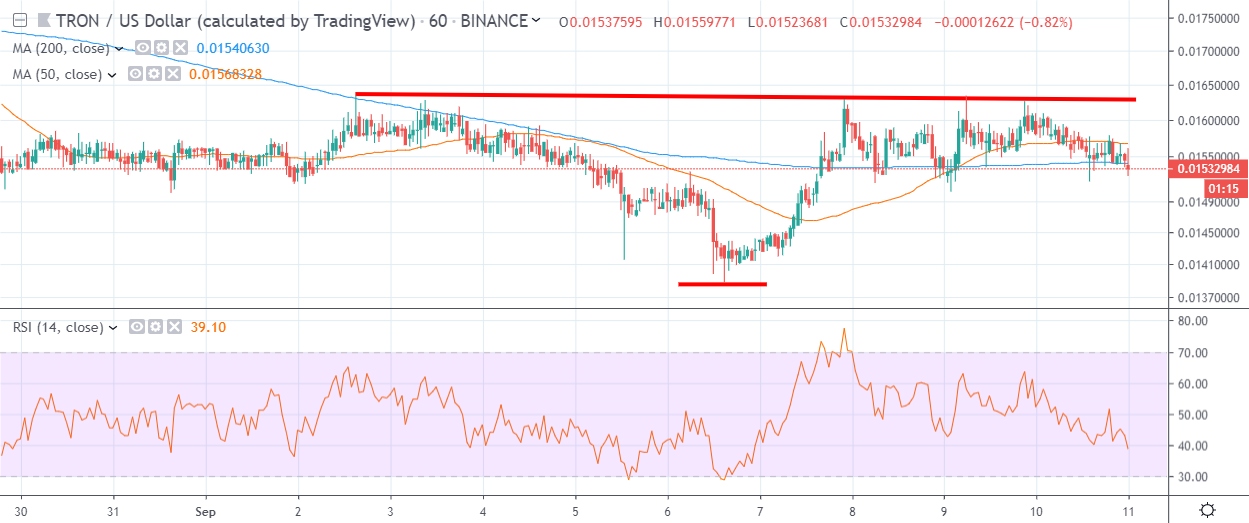
TRON has slipped back towards its monthly price open after giving back over five percent in gains since the start of the trading week. After falling to a new 2019 trading low last week, the TRX / USD pair had recovered over fifteen percent of its value, before finding strong technical resistance around the $0.016400 level.
The TRX / USD pair has been one of the worst affected major cryptocurrencies during the market recent sell-off, losing over seventy percent in value from its 2019 trading high. TRON has suffered two consecutive months of double-digit declines and is now trading in negative territory for 2019 by some fifteen percent.
Short-term technical analysis suggests that the TRX / USD pair could soon return to positive territory for the year. The one-hour and four-hour time frames depict bullish inverted head and shoulders patterns, with an upside projection of around twenty percent.
The medium-term picture for the cryptocurrency is less certain, as the TRX / USD pair is still probing the lower bounds of its historical trading range. The daily time frame shows that TRON is close to moving under a large bullish pattern, although technically the bullish inverted head and shoulders pattern is still valid.
Looking more closely at the daily time frame, the bullish scenario would take the TRX / USD pair back towards its current 2019 trading high, while the bearish scenario highlights the $0.012300 level as they next downside target if bears breach the current 2019 trading low.
According to the latest sentiment data from TheTIE.io, the short-term sentiment towards TRON is bullish, at 62.00 %, while the overall long-term sentiment towards the cryptocurrency is extremely bearish, at 29.06%.
Upside Potential
The four-hour time frame is showing that a sizeable inverted head and shoulders pattern has formed, with the neckline of the bullish pattern found around the current monthly trading high. The pattern suggests that the TRX / USD pair can rally towards the $0.019000 level if a bullish breakout occurs.
The daily time frame highlights that the $0.018800 level is the strongest form of near-term resistance, while the pair’s 200-day moving average is strong medium-term resistance, at the $0.026000 level.
Downside Potential
The four-hour time frame is showing that the TRX / USD pair could drop towards the $0.014400 level if selling pressure starts to pick-up below the $0.015000 level.
A breach of the current yearly trading low could see the TRX / USD pair falling towards the December 15th, 2018 trading low, around the $0.012300 level.
Summary
TRON shows strong double-digit upside potential in the short-term if bulls can start to advance the cryptocurrency above the September monthly trading high.
Medium-term analysis shows that TRX / USD bulls will need to rally price towards the $0.026000 level in order to place the cryptocurrency in a more desirable technical position.
Check out TRON in our coin guide.
Share this article
