
TRON Price Analysis TRX / USD: Waiting For The Sun
Rescheduling the Warren Buffet launch did not help TRX's price.
- TRON has a bearish short-term bias, with the cryptocurrency sold heavily from key resistance on the four-hour time frame
- The four-hour time frame shows a bearish head and shoulders pattern that has yet to reach its full downside target
- The daily time frame continues to show a valid inverted head and shoulders pattern
Fundamental Analysis
TRON’s price has been going down, after its CEO Justin Sun postponed the Warren Buffet launch due to health issues. The launch was scheduled for July 25. However, Tron Foundation announced that Sun has fallen ill with kidney stones, and the parties agreed to reschedule at a later date.
TRON / USD Short-term price analysis
TRON has a bearish short-term trading bias, with the cryptocurrency remaining under heavy technical selling pressure.
The four-time frame shows that the TRX / USD pair was sold sharply from the neckline of a bearish head and shoulders pattern. Sellers are now targeting back towards the current monthly trading low.
Technical indicators on the four-hour time frame have turned bearish and continue to issue strong sell signals.

Pattern Watch
Traders should note that the bearish head and shoulders pattern on the daily time frame has yet to reach its downside target.
Relative Strength Index
The Relative Strength Index has turned bearish on the four-hour time frame and shows scope for further downside.
MACD Indicator
The MACD indicator has turned bearish on the four-hour time frame, with the MACD histogram and signal line issuing strong sell signals.
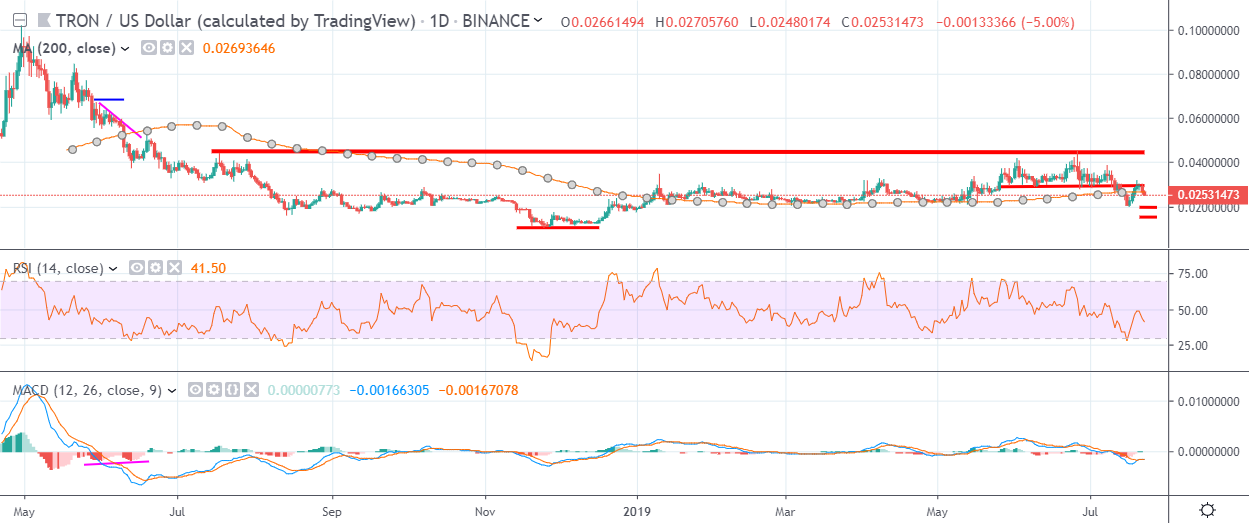
TRON / USD Medium-term price analysis
TRON has a bearish medium-term outlook, with the cryptocurrency once again trading below its trend defining 200-day moving average.
The daily time frame continues to show an inverted head and shoulders pattern, which could soon make the TRX / USD pair an attractive buying opportunity.
Technical indicators on the daily time frame are bearish and continue to generate sell signals.
Pattern Watch
Traders should note that the 0.020000 and the 0.150000 levels are the major upcoming support levels to watch on the daily time frame.
Relative Strength Index
The RSI indicator has once again turned bearish on the daily time frame, following a brief technical correction.
MACD Indicator
The MACD indicator on the daily time frame remains bearish and continues to issue a sell signal. Bullish MACD divergence is also still present on the daily time frame.
Conclusion
TRON is back under technical pressure across both time horizons, following a swift technical rejection from major resistance on the four-hour time frame.
The inverted head and shoulders pattern and the positive MACD divergence on the daily time frame both suggest the TRX / USD pair could soon become an attractive medium-term buy once the downside has fully played out.
Check out TRON in our coin guide.