
TRX / USD Price Analysis: Resisting Pressure
TRON has a positive outlook and remained relatively unaffected by the market downturn, though selling pressure mounts in the short-term.
- TRX is bearish over the short-term, with the cryptocurrency trading below its 200-period moving average on the four-hour time frame
- The TRX / USD pair is now consolidating above its 200-day moving average
- The daily time frame continues to show a valid inverted head and shoulders pattern
TRON / USD Short-term price analysis
TRX has a bearish short-term trading bias, with the cryptocurrency now trading below its 200-period moving average on the four-hour time frame.
The four-hour time frame shows the presence of a head and shoulders pattern with the TRX / USD pair edging towards the neckline of the bearish pattern.
Technical indicators on the four-hour time frame are bullish and continue to point to further upside in the short-term.
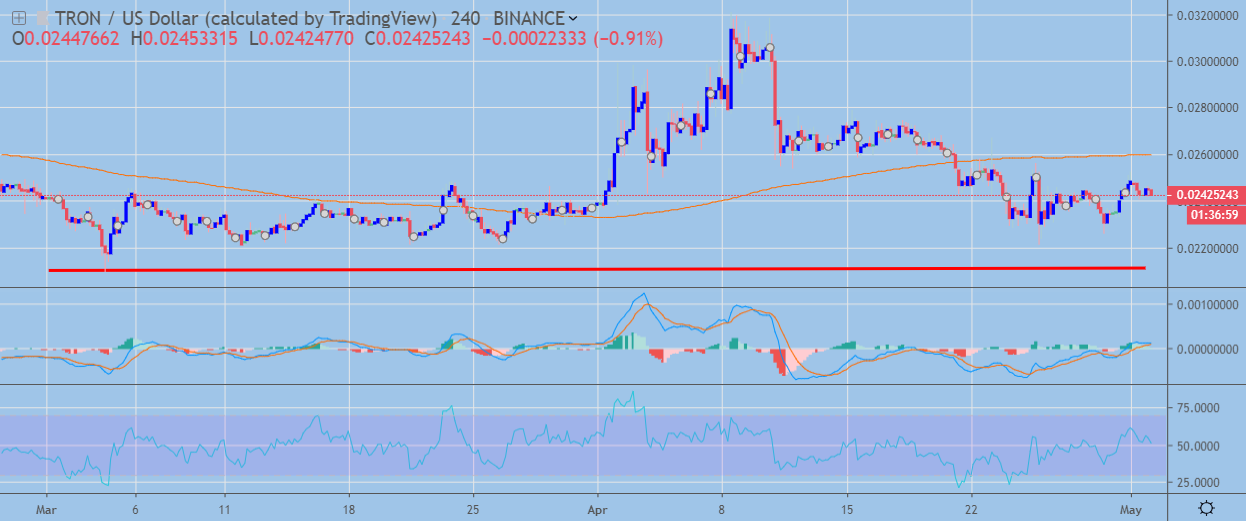 TRX / USD H4 Chart by TradingView
Pattern Watch
Traders should note that the TRX / USD pair could fall to a new 2019 trading low if the head and shoulders pattern on the four-hour time frame is triggered.
Relative Strength Index
The Relative Strength Index has turned bullish on the four-hour time frame and shows scope for further upside.
MACD Indicator
The MACD indicator has turned bullish on the four-hour time frame and is currently issuing a buy signal.
TRON / USD Medium-term price analysis
TRX has a bullish medium-term outlook, with the TRX / USD pair still maintaining price above its key 200-day moving average.
The daily time frame continues to show a large inverted head and shoulders pattern, with bullish MACD price divergence still evident from June 2018.
Technical indicators on the daily time frame are attempting to stabilize following the recent decline in the TRX / USD pair.
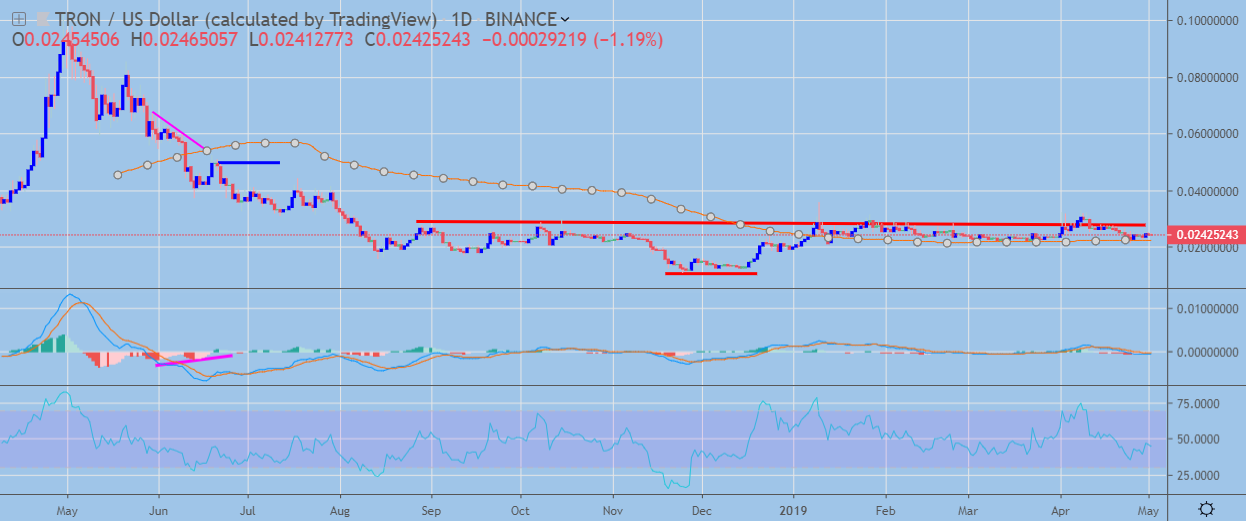 TRX / USD Daily Chart by TradingView
Pattern Watch
Traders should note that the June 21st, 2018 swing-high is the upside target of the inverted head and shoulders pattern on the daily time frame.
Relative Strength Index
The RSI indicator is still bearish on the daily time frame, although it is attempting to recover higher.
MACD Indicator
The MACD indicator on the daily time frame is flat and is currently failing to generate a clear trading signal.
Conclusion
TRX is under pressure in the short-term, with the bearish pattern on the four-hour time frame issuing a warning that the cryptocurrency could still decline further.
The prospects for the TRX / USD pair remain bright, with the inverted head and shoulders pattern and the presence of bullish MACD divergence on the daily time frame still pointing to more upside over the medium-term.
Check out our coin guide for TRON.