VeChain Price Analysis VET / USD: Mediocre Recovery
VET is showing signs of recovery, but it may be just a correction.

Share this article
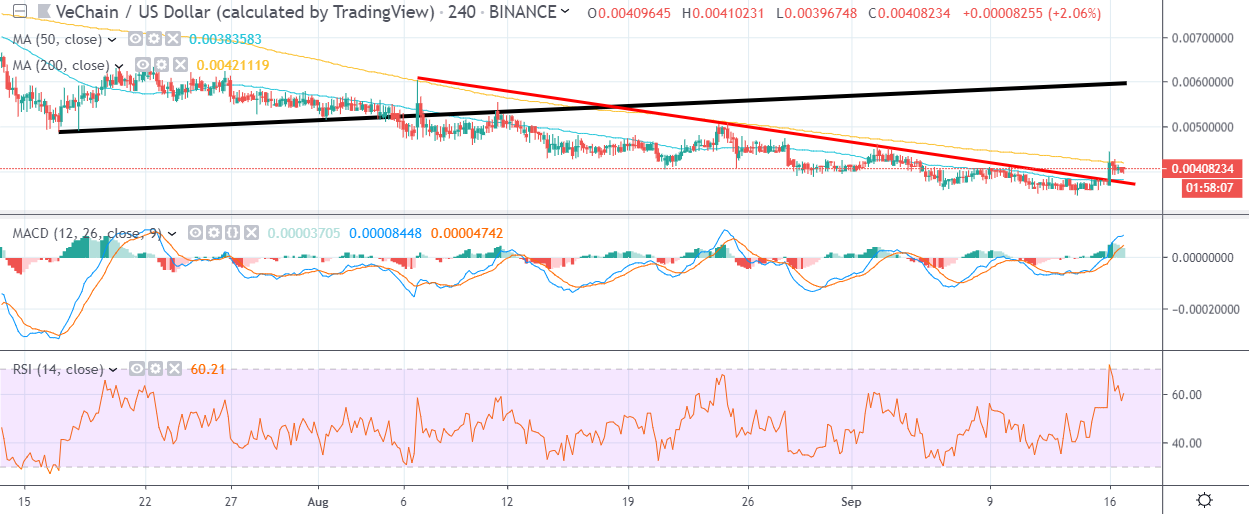
- VeChain is testing its 200-period moving on the four-hour time frame for the first time this month
- The VET / USD pair has so far failed to turn bullish over the short-term
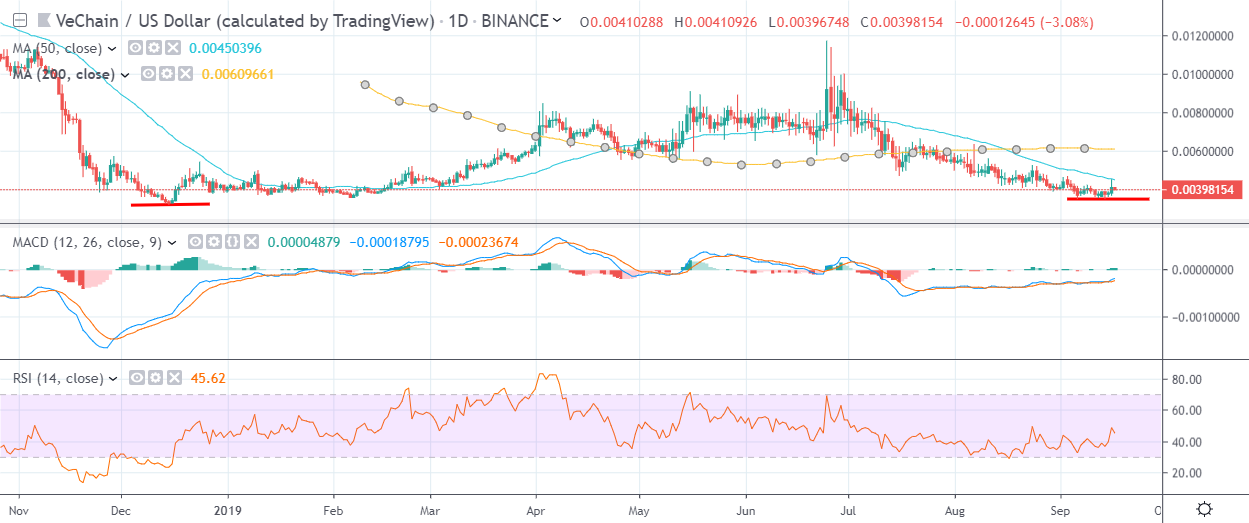
- The daily time frame shows the formation of a potential double-bottom pattern
VeChain is starting to attempt a short-term upside recovery after enduring eight consecutive weeks of heavy trading losses. The cryptocurrency briefly moved above its 200-period moving average on the four-hour time for the first time since early July, before being sold sharply lower.
The VET / USD pair has been one of the worst affected cryptocurrencies by the summer decline in the altcoin space, having remained under almost constant selling pressure since June. In percentage terms, the cryptocurrency has eroded close to sixty-five percent of its value from its 2019 trading peak.
VeChain is different from many other leading cryptocurrencies, in that it currently lacks any apparent bullish reversal patterns on the lower time frames or obviously negative MACD price divergence. In fact, a potential double-pattern on the daily time frame is the only pattern that suggests a bullish reversal may be on the horizon.
With this in mind, and the overly bearish nature of the daily time frame chart it is fair to suggest that any move higher in the cryptocurrency could be a technical correction within a larger down trend, rather than a meaningful reversal.
As far as possible upside targets for the VET / USD pair, the four-hour and daily time frames are currently highlighting the 0.060000 level as a likely area that the cryptocurrency could gravitate towards if bulls can hold price above the major short-term moving average.
Failure to maintain price above the 50-period and 200-period moving averages on the four-hour time frame could cast doubt of the recent short-term recovery and potentially force a test towards the trading lows of the summer.
According to the latest sentiment data from TheTIE.io, the short-term sentiment towards VeChain is largely neutral 54.00 %, while the overall long-term sentiment towards the cryptocurrency is slightly bullish, at 64.00%.
Upside Potential
The four-hour time frame is showing that VET / USD pair could target towards major upsloping trendline resistance, around the $0.006000 level, if buyers can start to move price above the cryptocurrency’s 200-period moving average on the mentioned time frame.
The daily time frame highlights that the VET / USD pair’s 200-day moving average is currently aligning with major trendline resistance on the four-hour time frame.
It is worth noting that a move towards the cryptocurrency’s 200-day moving average from current trading levels would mark a fifty percent increase in the value of the VET / USD.
Downside Potential
The four-hour time frame is showing that the VET / USD pair is currently unable to move above its key moving average. Continued failure may prompt a test towards the worst levels of the summer.
The daily time frame is still showing a large head and shoulders pattern, which may eventually play-out to the downside once a potential upside correction has unfolded.
Summary
VeChain is showing signs of a potential upside recovery, although bulls must soon move price above the major moving average on the four-hour time frames.
Overall, the absence of bullish patterns on both the lower and higher time frames suggests that any upside move may be just a technical correction rather than a meaningful recovery.
For a quick look into VeChain and VET, check out our coin guide here.
If you need a deeper analysis, look into our VeChain DARE.
Share this article
