 Earn with Nexo

Verge Price Analysis XVG / USD: Back In The Coffin
Verge is failing to hit investor ghouls - sorry, goals - after a brief revival.
- Verge has a bearish short-term bias, with the cryptocurrency trading well below its 200-period moving average on the four-hour time frame
- The four-hour time frame continues to show a large inverted head and shoulders pattern
- The daily time frame is still showing that the XVG / USD pair remains trapped within a large horizontal price channel
Verge / USD Short-term price analysis
Verge has a bearish short-term trading bias, with the cryptocurrency now trading below its 200-period moving average on the four-hour time frame.
The four-hour time frame shows that a large inverted head and shoulders pattern has now formed, with sellers working hard to invalidate the bullish pattern.
Technical indicators on the four-hour time frame are bearish and also appear overstretched to the downside.
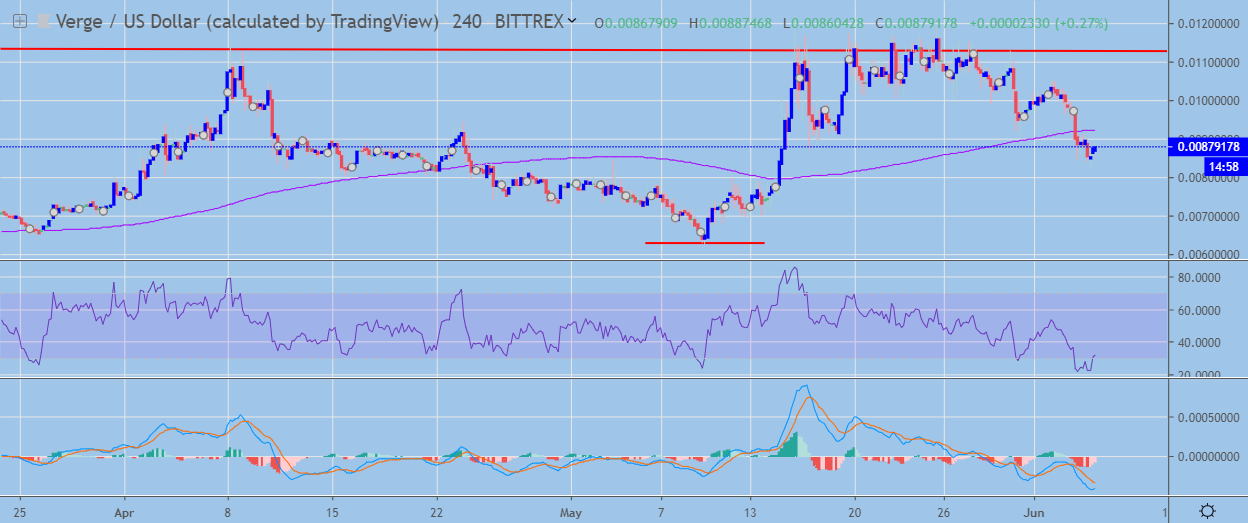 XVG / USD H4 Chart by TradingView
Pattern Watch
Traders should note that the October 2018 trading high is the overall upside target of the inverted head and shoulders pattern on the four-hour time frame.
Relative Strength Index
The Relative Strength indicator remains bearish on the four-hour time frame, although it is attempting to correct from extremely oversold conditions.
MACD Indicator
The MACD indicator on the four-hour time frame remains bearish, although it appears overstretched.
Verge / USD Medium-term price analysis
Verge has a bullish medium-term trading bias, with the XVG / USD pair still trading above its trend defining 200-day moving average.
The daily time frame shows that the XVG / USD pair is trapped within a horizontal price channel and is now moving lower after testing towards the top of the neutral price channel.
Technical indicators on the daily time frame have turned bearish and continue to generate sell signals.
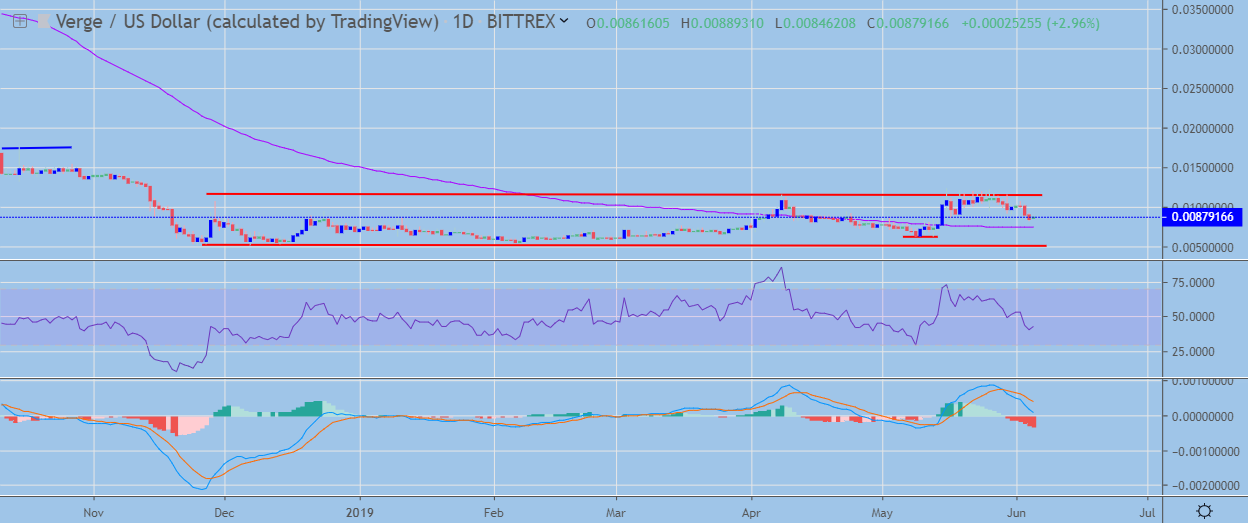 XVG / USD Daily Chart by TradingView
Pattern Watch
Traders should note that a bullish inverted head and shoulders pattern is also visible on the daily time frame.
Relative Strength Index
The Relative Strength indicator has turned bearish on the daily time frame, highlighting the growing medium-term selling pressure.
MACD Indicator
The MACD indicator has turned bearish, with both the MACD signal line and histogram issuing a strong sell signal.
Conclusion
Verge is coming under downside pressure across both time horizons after failing to break away from its longer-term trading range.
The bullish patterns on the four-hour and daily time frames still suggest that XVG / USD pair could eventually perform a much needed bullish breakout.
Check out what Verge is all about and its strange history.