Verge Price Analysis XVG / USD: Ambivalent Signals
Technical indicators give mixed signals for XVG.

Share this article
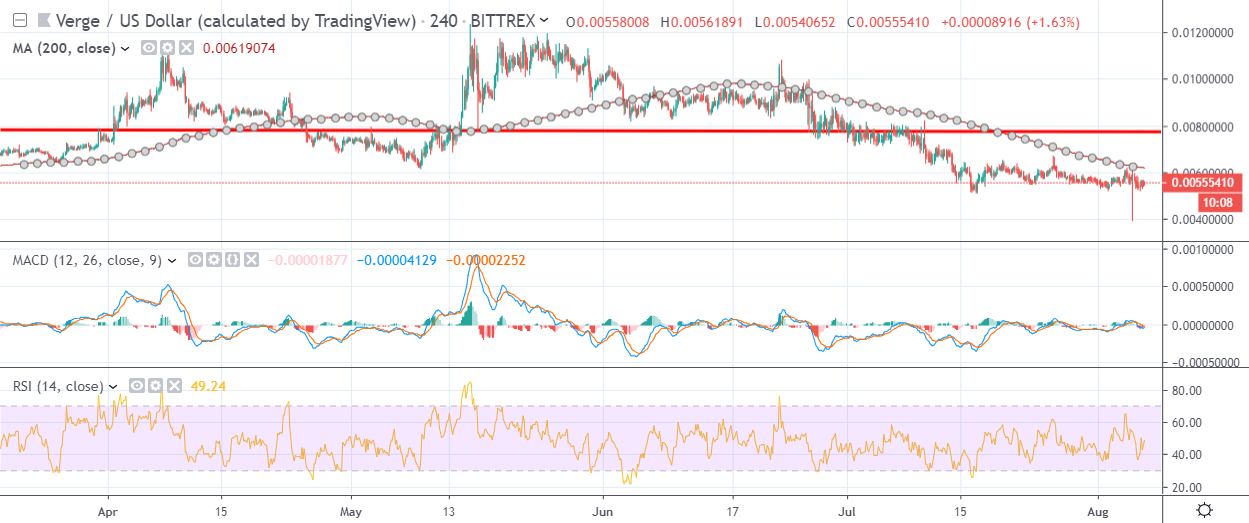
- Verge has a bearish short-term bias, with the cryptocurrency trading below its 200-period moving average on the four-hour time frame
- The four-hour time frame shows that a bearish head and shoulders pattern has reached its full downside projection
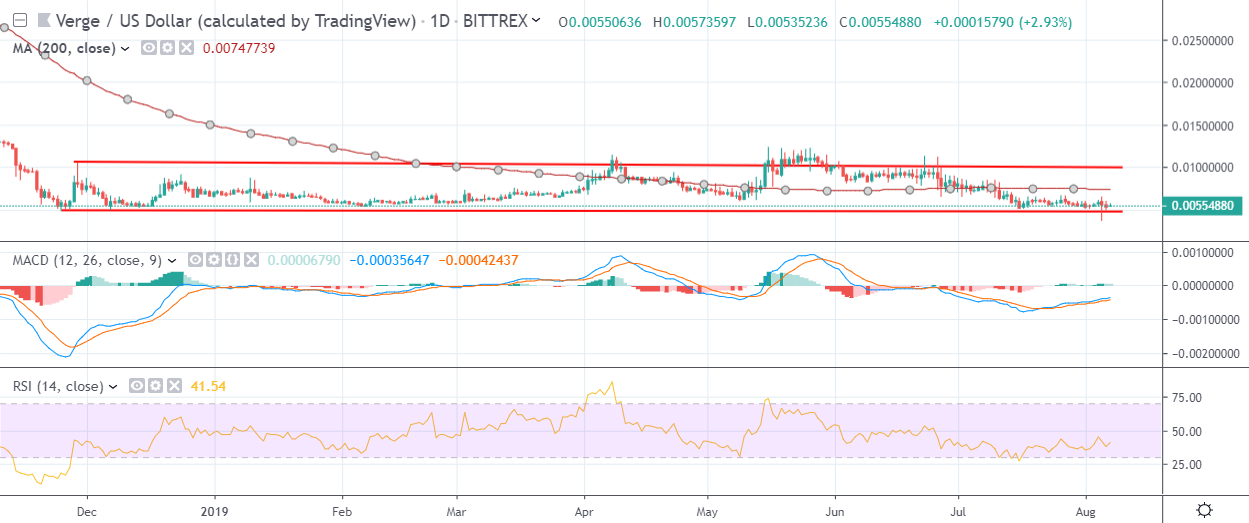
- The daily time frame is showing that the XVG / USD pair is still trading within a large horizontal price channel
Verge / USD Short-term price analysis
Verge has a bearish short-term trading bias, with the cryptocurrency still trading below its 200-period moving average on the four-hour time frame.
The four-hour time frame shows that the head and shoulders pattern has now reached its full downside projection. Now that the downside target has been achieved, the XVG / USD pair may start to stage a short-term recovery.
Technical indicators on the four-hour time frame are neutral and currently failing to generate a clear trading signal.
Pattern Watch
Traders should note that a bullish reversal pattern could start to form now that the head and shoulders pattern on the four-hour time frame has reached its downside objective.
Relative Strength Index
The Relative Strength Index is rising on the four-hour time frame, although it is failing to generate a clear trading signal.
MACD Indicator
The MACD indicator on the four-hour time frame is neutral and is currently failing to generate a trading signal.
Verge / USD Medium-term price analysis
Verge has a bearish medium-term trading bias, with the XVG / USD pair trading below its trend defining 200-day moving average.
The daily time frame shows that the XVG / USD pair is still trapped within a horizontal price channel, following a false downside breakout below the long-standing channel.
Technical indicators on the daily time frame remain technically bearish.
Pattern Watch
Traders should note that traders may test towards the top side of the price channel if sellers fail to move price under the horizontal channel.
Relative Strength Index
The Relative Strength Index remains technically bearish on the daily time frame.
MACD Indicator
The MACD indicator is rising, although it is failing to generate a clear trading signal on the daily time frame.
Conclusion
Verge is staging a short-term rebound, after the bearish head and shoulders pattern on the four-hour time frame played-out to its full downside projection.
Failure to break below the horizontal price channel on the daily time frame may prompt buyers to push the XVG / USD pair higher.
Check out what Verge is all about and its strange history.
Share this article
