Verge Price Analysis XVG / USD: Dead Cat Bounce
Verge is rebounding after a long decline with most indicators turning bullish.

Share this article
- Verge has turned bullish in the short-term, with the cryptocurrency trading well above its 200-period moving average on the four-hour time frame
- The XVG / USD pair has now broken above its key 200-day moving average
- Bearish head and shoulders patterns remain valid on the four-hour and daily time frames
Verge / USD Short-term price analysis
Verge has a bullish short-term trading outlook, with the cryptocurrency now trading above its 200-period moving average on the four-hour time frame.
The four-hour time frame shows a large head and shoulders pattern, with buyers now attempting to invalidate the bearish pattern.
Technical indicators on the four-hour time frame have turned bullish and continue to issue a strong buy signal.
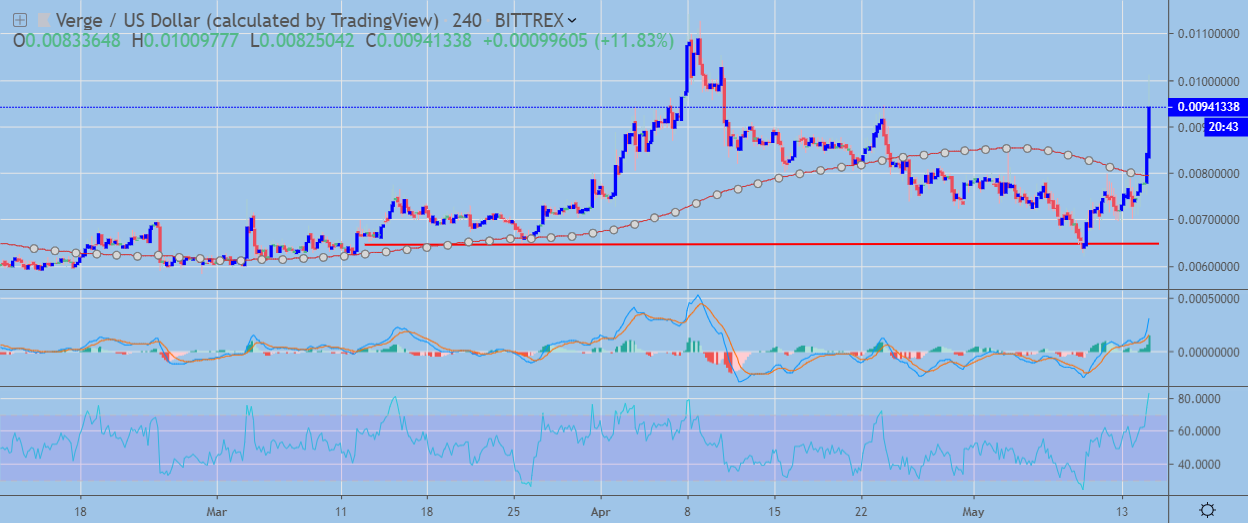 XVG / USD H4 Chart by TradingView
Pattern Watch
Traders should note that a large inverted head and shoulders pattern could form if the bearish pattern on the four-hour time frame is invalidated.
Relative Strength Index
The Relative Strength indicator has turned bullish on the four-hour time frame, although it is now extremely overbought.
MACD Indicator
The MACD indicator has turned bullish on the four-hour time frame and continues to issue a strong buy signal.
Verge / USD Medium-term price analysis
Verge has turned bullish over the medium-term, with the XVG / USD pair now trading above its 200-day moving average.
The daily time frame highlights the recent breakout rally and shows a large head and shoulders pattern, with bulls now working hard to invalidate the bearish pattern.
Technical indicators on the daily time frame have turned bullish and continue to generate a strong buy signal.
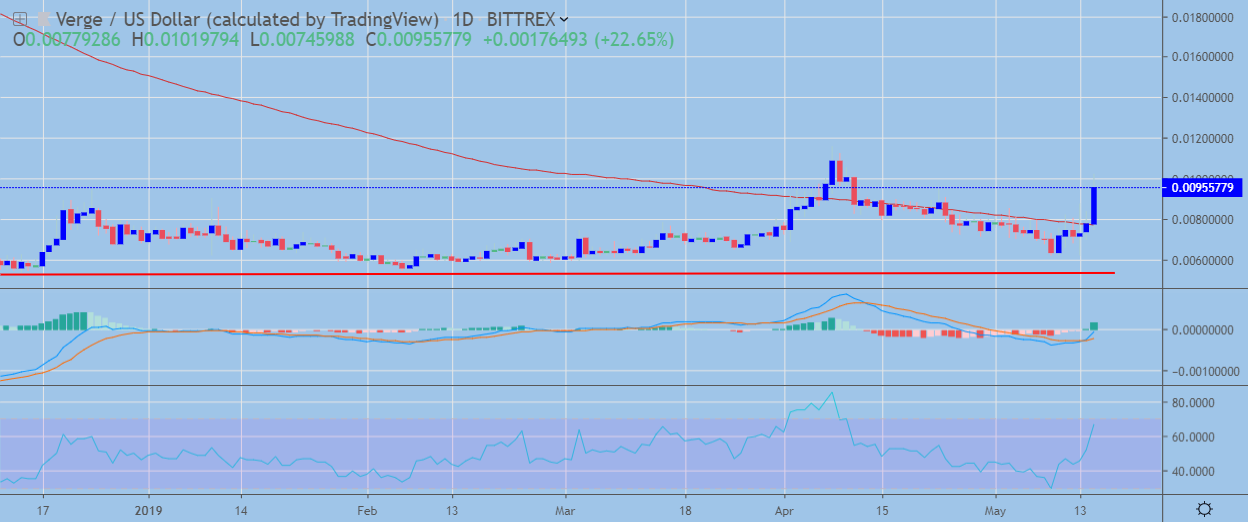 XVG / USD Daily Chart by TradingView
Pattern Watch
Traders should note that a strong bullish breakout will likely occur if price advances above the head of the bearish head and shoulders pattern on the daily time frame.
Relative Strength Index
The Relative Strength indicator has turned bullish on the daily time frame, highlighting the growing medium-term upside pressure.
MACD Indicator
The MACD histogram has turned bullish, with the MACD signal line issuing a strong buy signal.
Conclusion
Verge has staged an impressive bullish breakout above its key moving averages on both time horizons. The cryptocurrency now has the potential to stage an even stronger upside rally if bulls can negate the bearish patterns on the four-hour and daily time frames.
Head over to our coin guide for Verge for a bit of history on the project.
Share this article
