 Earn with Nexo

Waves Price Analysis WAVES / USD: Defying Gravity
Waves had a massive surge that instantly brought it to a bullish outlook
- Waves has a bullish short-term outlook, with the cryptocurrency advancing to a new 2019 trading high
- The four-hour time frame shows that a bullish inverted head and shoulders pattern has formed
- The daily time frame highlights that a bullish triangle pattern breakout has occurred
Waves / USD Short-term price analysis
Waves has a bullish short-term outlook, with the cryptocurrency advancing to a new 2019 trading high.
The four-hour time frame shows that a bearish head and shoulders pattern has been invalidated, with the upside breakout creating a bullish inverted head and shoulders pattern.
Technical indicators across the four-hour time frame have turned bullish and continue to issue a buy signal.
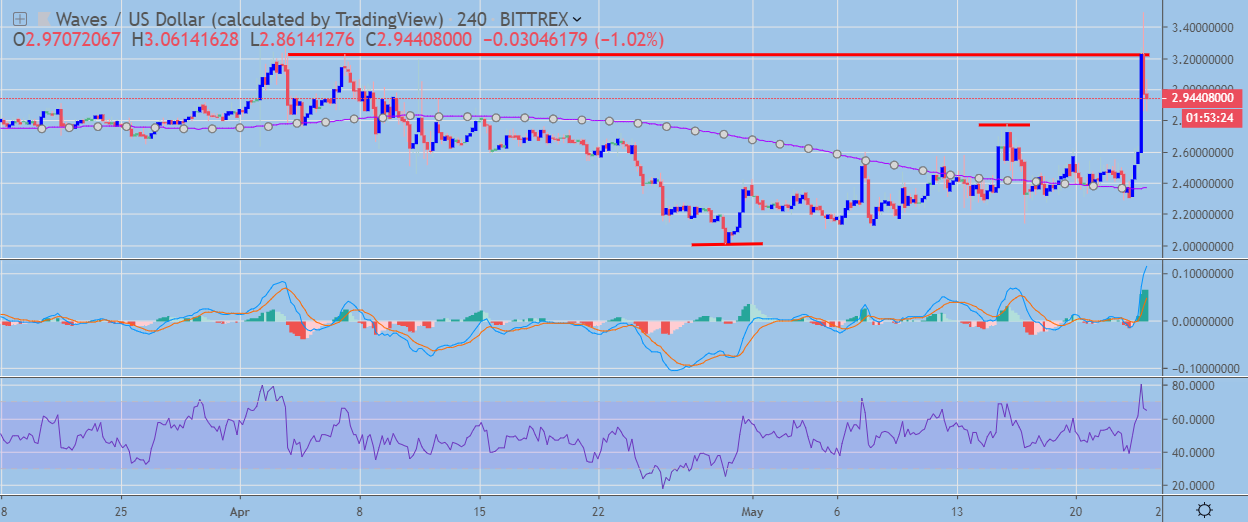 WAVES / USD H4 Chart by TradingView
Pattern Watch
Traders should note that the head of the invalidated head and shoulders pattern is now critical technical support the four-hour time frame.
Relative Strength Index
The RSI indicator on the four-hour time frame is bullish, although it is correcting from overbought conditions.
MACD Indicator
The MACD indicator on the four-hour time frame has turned bullish, with the MACD signal line and histogram issuing buy signals.
Waves / USD Medium-term price analysis
Waves has a bullish medium-term outlook, with buyers moving the WAVES / USD pair above its trend defining 200-day moving average.
The daily time frame is showing that a bullish breakout has occurred from a symmetrical triangle pattern, with the WAVES / USD pair now testing back towards trendline support.
Technical indicators on the daily time frame are bullish and continue to issue a buy signal.
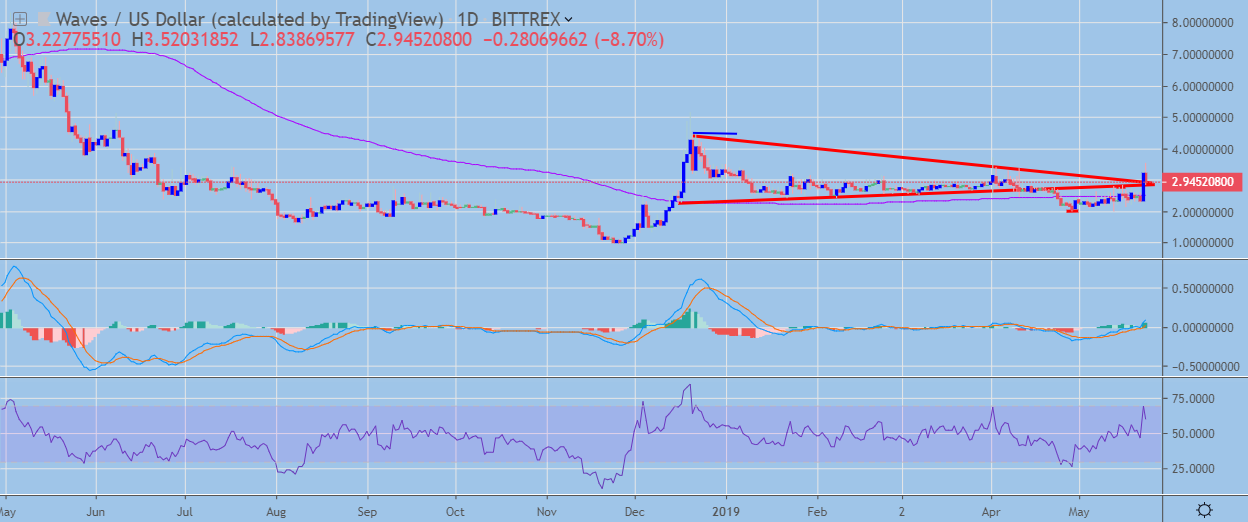 WAVES / USD Daily Chart by TradingView
Pattern Watch
Traders should note that the December 2018 monthly high is the initial upside target of the bullish triangle breakout.
Relative Strength Index
The RSI indicator on the daily time frame is bullish, although it is currently correcting from overbought conditions.
MACD Indicator
The MACD indicator on the daily time frame is bullish and continues to issue a strong buy signal.
Conclusion
Waves has staged an impressive upside recovery after coming under technical selling pressure below its 200-day moving average earlier this month.
The four-hour and daily time frames both show that large bullish patterns have now been created, which further underscores that the path of least resistance is now to the upside for the WAVES / USD pair.
Check out our coin guide for Waves.
We wrote several analytical reports on Waves, including the initiation and updates.