
Waves Price Analysis WAVES / USD: Oscillating At The Bottom
Waves is hovering around its 2019 low.
- Waves has a bearish short-term outlook, with the cryptocurrency under heavy technical pressure
- The four-hour time frame shows that sellers have now invalidated a bullish inverted head and shoulders pattern
- The daily time frame shows that the WAVES / USD pair is trading within a large falling wedge pattern
Waves / USD Short-term price analysis
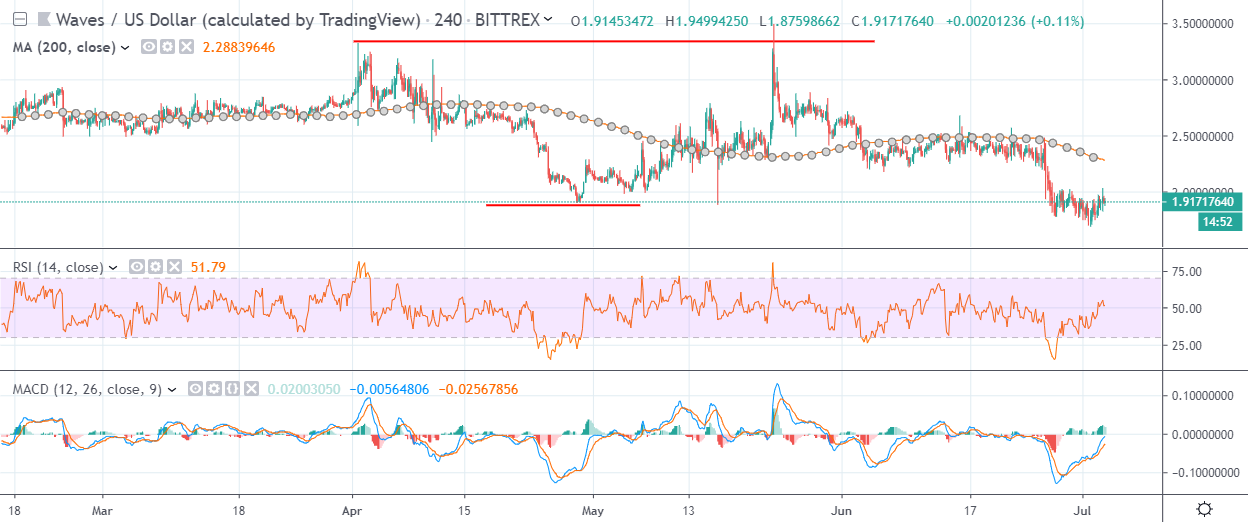
Waves has a bearish short-term trading outlook, with the cryptocurrency trapped around its current 2019 trading low.
The four-hour time frame shows that a bullish inverted head and shoulders pattern has been invalidated, with sellers holding price close to the downside breakout point.
Technical indicators across the four-hour time frame have turned bullish and are starting to issue a buy signal.
Pattern Watch
Traders should note that the invalidation target of the inverted head and shoulders pattern could lead to substantial losses for the Waves/USD pair.
Relative Strength Index
The RSI indicator on the four-hour time frame has turned bullish and shows room for further upside.
MACD Indicator
The MACD indicator on the four-hour time frame has turned bullish, with the MACD signal line and histogram both issuing buy signals.
Waves / USD Medium-term price analysis
Waves has a bearish medium-term outlook, with sellers moving the WAVES / USD pair under its trend defining 200-day moving average.
The daily time frame is showing that the WAVES / USD pair is trapped within a falling wedge pattern and is now starting to move away from the top of the bullish pattern.
Technical indicators on the daily time frame are bearish and continue to issue a sell signal.

Pattern Watch
Traders should watch for a potential move towards the bottom of the falling wedge pattern, following repeated technical failures at trendline resistance.
Relative Strength Index
The RSI indicator on the daily time frame is attempting to correct higher, although it remains technically bearish.
MACD Indicator
The MACD indicator on the daily time frame is bearish and continues to issue a sell signal.
Conclusion
Waves has staged a muted short-term recovery after previously coming under heavy technical selling pressure below its 200-period moving average.
Medium-term bulls have repeatedly failed to move price above the large bullish pattern on the daily time frame, leaving the WAVES / USD pair exposed to further technical selling.
Check out our coin guide for Waves.
We wrote several analytical reports on Waves, including the initiation and updates.