
Waves Price Analysis WAVES / USD: Protection Needed
Waves is exposed to technical selling.
- Waves has a bearish short-term outlook, with the cryptocurrency trading at its lowest level since December 2018
- The four-hour time frame shows that a bearish head and shoulders pattern has been triggered into action
- The daily time frame shows that the WAVES / USD pair has slipped under a falling wedge pattern
Waves / USD Short-term price analysis
Waves has a bearish short-term trading outlook, with the cryptocurrency now trading at its lowest level since December 2018.
The four-hour time frame shows that a bearish head and shoulders pattern has been triggered, with the downside breakout yet to reach its over overall target.
Technical indicators across the four-hour time frame are rising and are starting to issue a bullish trading signal.
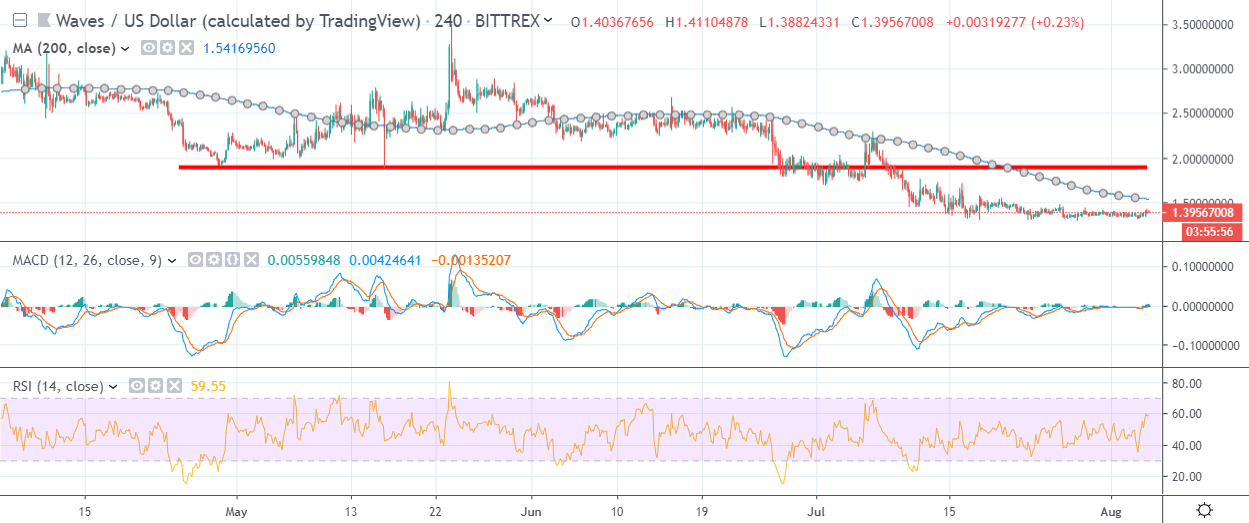
Pattern Watch
Traders should note that the WAVES / USD pair is in an extremely vulnerable technical position while trading below the neckline of the head and shoulders pattern.
Relative Strength Index
The RSI indicator on the four-hour time frame has turned bullish and shows scope for further upside.
MACD Indicator
The MACD indicator on the four-hour time frame has now turned bullish, with the MACD signal line and histogram both issuing buy signals.
Waves / USD Medium-term price analysis
Waves has a bearish medium-term outlook, with sellers moving the WAVES / USD pair trading below key trendline support on the daily time frame.
The daily time frame is showing that the WAVES / USD pair has now broken under a falling wedge pattern, leaving the cryptocurrency exposed to further medium-term selling.
Technical indicators on the daily time frame are attempting to correct form extreme oversold territory.
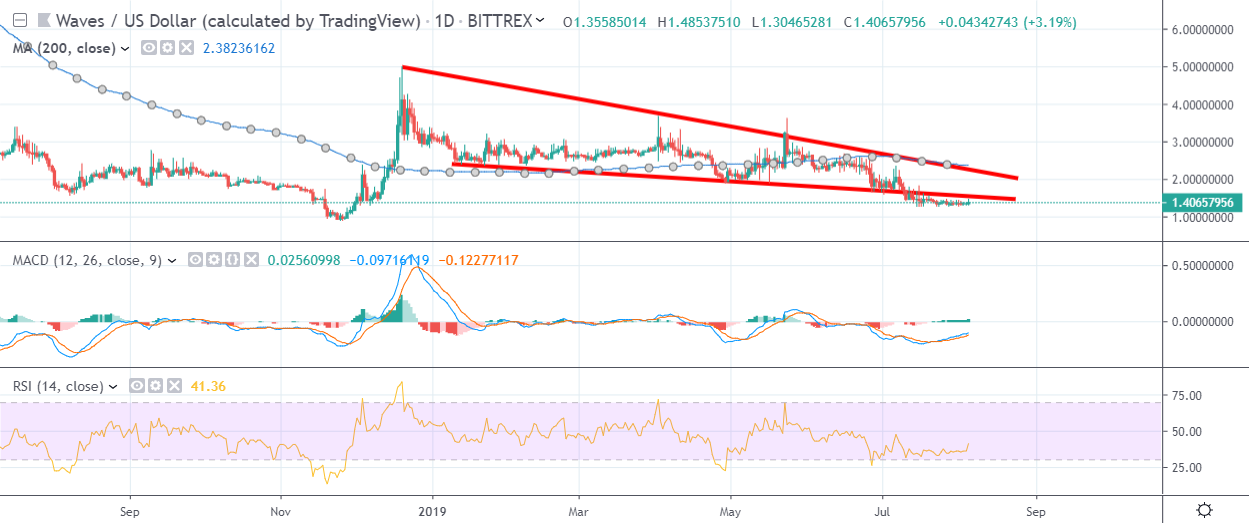
Pattern Watch
Traders should note that falling wedge patterns are typically considered to be bullish reversal pattern.
Relative Strength Index
The RSI indicator on the daily time frame is attempting to correct higher, although it remains technically bearish.
MACD Indicator
The MACD indicator on the daily time frame has now turned bullish and is starting to issue a buy signal.
Conclusion
Waves remains technically bearish across both the four-hour and daily time frames, leaving itself exposed to another round of technical selling.
Bulls will need to move price back inside the large falling wedge pattern on the daily time frame to encourage some form of technical correction.
Check out our coin guide for Waves.
We wrote several analytical reports on Waves, including the initiation and updates.