 Earn with Nexo

WAVES / USD Price Analysis: On A Knife’s Edge
After testing its 2019 low, the pair has staged a limited recovery but the outlook is still bearish.
- WAVES retains its bearish short-term outlook, with the cryptocurrency still trading below its 200-period moving average on the four-hour time frame
- WAVES / USD remains bearish over the medium-term
- Medium-term bulls need to perform multiple daily price closes above the WAVES / USD pair’s 200-day moving average
WAVES / USD Short-term price analysis
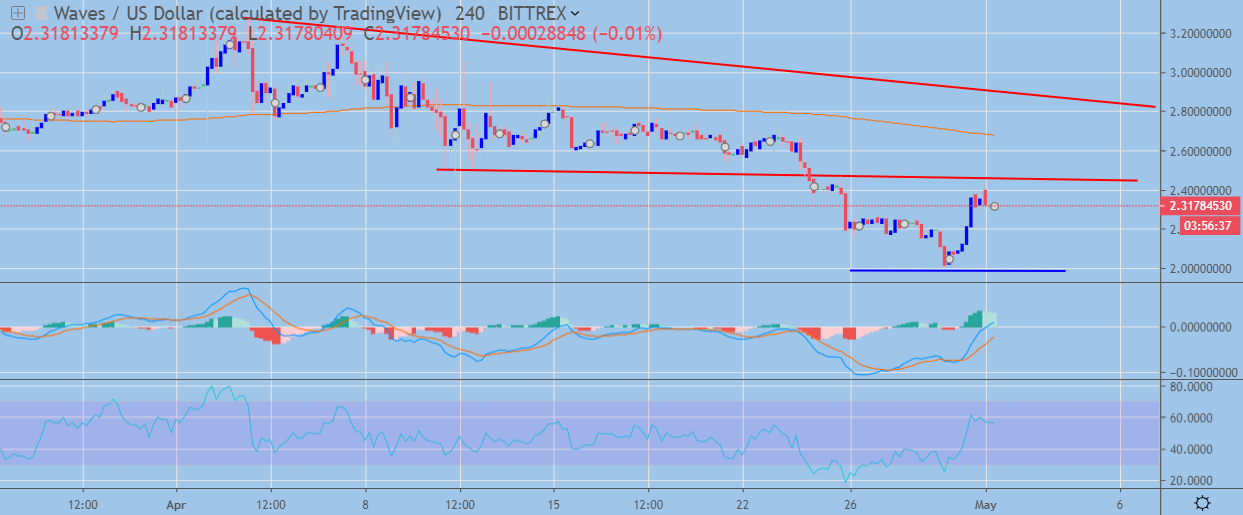
WAVES has a bearish short-term outlook, with the cryptocurrency still trading well below its 200-period moving average on the four-hour time frame.
The four-hour time frame shows that bulls are testing towards key trendline resistance after the WAVES / USD pair made a strong recovery following a recent fall to a new 2019 trading low.
Technical indicators across the four-hour time frame have turned bullish and continue to issue a buy signal.
 WAVES / USD H4 Chart by TradingView
Pattern Watch
Traders should note that a bullish inverted head and shoulders pattern could start to form across the four-hour time frame if bulls move price above the WAVES / USD pair’s 200-period moving average.
Relative Strength Index
The RSI indicator on the four-hour time frame has turned bullish and shows scope for further upside.
MACD Indicator
The MACD indicator on the four-hour time frame has turned bullish, with the MACD signal line issuing a buy signal.
WAVES / USD Medium-term price analysis
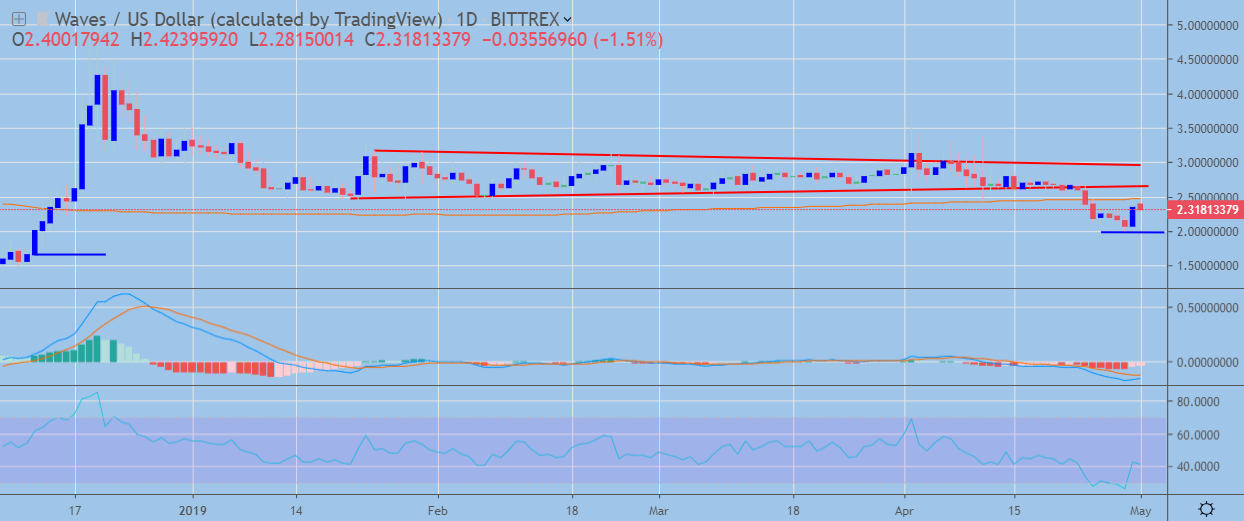
WAVES retains its bearish medium-term outlook, with buyers still unable to move price above the WAVES / USD pair’s 200-day moving average.
The daily time frame shows that the recent bearish breakout from the symmetrical triangle pattern has reached its overall downside objective.
Technical indicators on the daily time frame remain bearish, despite the recent move higher.
 WAVES / USD Daily Chart by TradingView
Pattern Watch
Traders should note that the December 12th, 2018 swing low offers the strongest form of support if the current 2019 trading low is broken.
Relative Strength Index
The RSI indicator on the daily time frame remains bearish, although it is attempting to move higher.
MACD Indicator
The MACD indicator on the daily time frame remains bearish, despite the recent strong upside recovery.
Conclusion
Following the latest moves higher WAVES is now finely balanced across both time horizons. If short-term bulls can force price above key upcoming resistance, a bullish pattern could start to emerge across the four-hour time frame.
Caution is still required, as sustained technical failure from current levels will likely prompt another technical test of the current 2019 trading low.
Check out our coin guide for Waves.