
WAVES / USD Price Analysis: Sting Of Rejection
Waves failed to overcome its moving averages, with the trend now being fully negative in the foreseeable future.
- Waves has a bearish short-term outlook, with the cryptocurrency failing to move above its 200-period moving average on the four-hour time frame
- The WAVES / USD pair remains bearish over the medium-term horizon
- The daily time frame shows that the bearish triangle pattern breakout has yet to reach its full downside projection
Waves / USD Short-term price analysis
WAVES has a bearish short-term outlook, with the cryptocurrency still unable to move above its 200-period moving average on the four-hour time frame.
The four-hour time frame shows that a strong technical rejection has occurred after bulls were unable to move price above the neckline of the head and shoulders pattern.
Technical indicators on the four-hour time frame are neutral and failing to generate a clear trading signal.
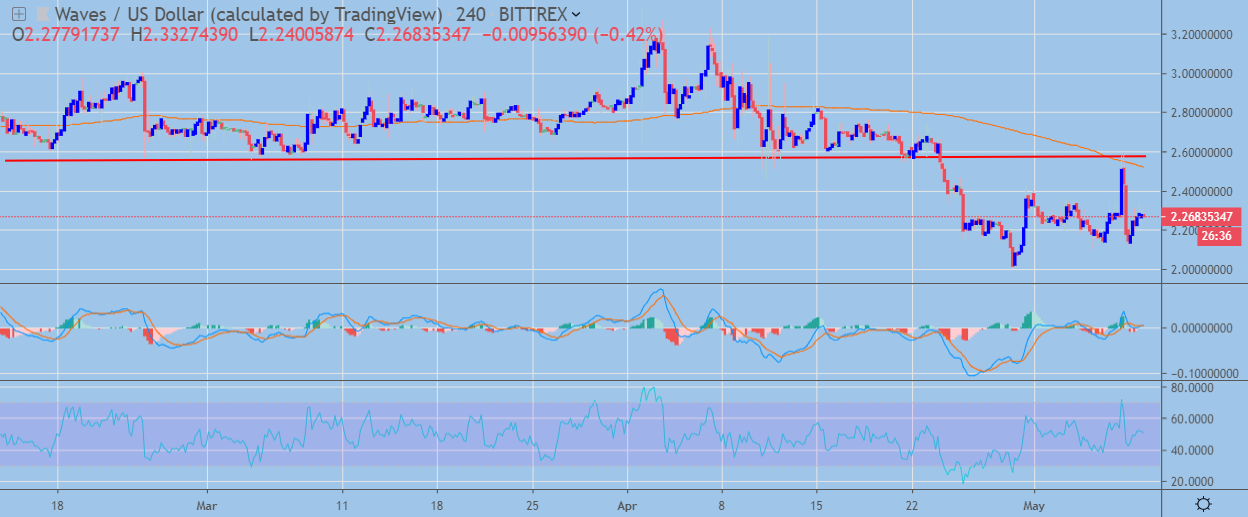 WAVES / USD H4 Chart by TradingView
Pattern Watch
Traders should note that a small head and shoulders pattern may be forming on the four-hour time frame.
Relative Strength Index
The RSI indicator on the four-hour time frame is also failing to provide a clear trading signal.
MACD Indicator
The MACD indicator on the four-hour time frame is neutral and is currently failing to generate a clear trading signal.
Waves / USD Medium-term price analysis
WAVES has a bearish medium-term trading outlook, with the WAVES / USD pair’s 200-day moving average still acting as strong technical resistance.
The daily time frame is showing that the recent bearish breakout from the symmetrical triangle pattern remains valid, with bulls once again failing to move price above trendline resistance.
Technical indicators on the daily time frame are rising, although they have yet to turn bullish.
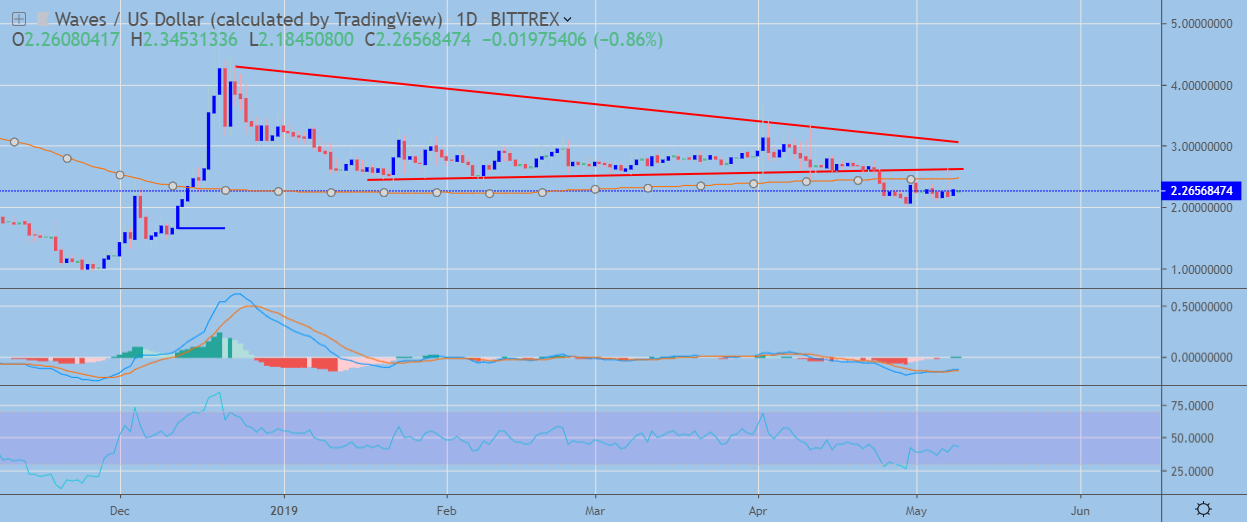 WAVES / USD Daily Chart by TradingView
Pattern Watch
Traders should note that the December 12th, 2018 swing-low is the target of the bearish symmetrical triangle breakout.
Relative Strength Index
The RSI indicator on the daily time frame is attempting to recover higher, although it is still bearish.
MACD Indicator
The MACD indicator on the daily time frame is rising, although it has yet to issue a buy signal.
Conclusion
WAVES remains under downside pressure after bulls were unable to move the cryptocurrency back above major technical resistance on both time horizons.
The bearish triangle breakout on the daily time frame still suggests that the WAVES / USD pair can still trade lower over the medium-term.
Check out our coin guide for Waves.
We wrote several analytical reports on Waves, including the initiation and updates.