 Earn with Nexo

XRP / USD Price Analysis: Bullish Strength Pushes Case For Flippening
Ripple is trading above its 200-day moving average for the first time this year, and all other indicators remain solid.
- Ripple has a bullish short-term trading bias, with the cryptocurrency breaking above its 200-period moving average
- The XRP / USD pair has now moved above its 200-day moving average for the first time this year
- The daily time frame shows that a bullish triangle pattern breakout has now occurred
Ripple / USD Short-term price analysis
Ripple has a bullish short-term trading bias, with the XRP / USD pair now trading at its highest level since early January this year.
The four-hour time frame shows that buyers have now invalidated the large head and shoulders pattern, with XRP / USD pair now trading well above the bearish pattern.
Technical indicators across the four-hour time frame have turned bullish and continue to issue a strong buy signal.
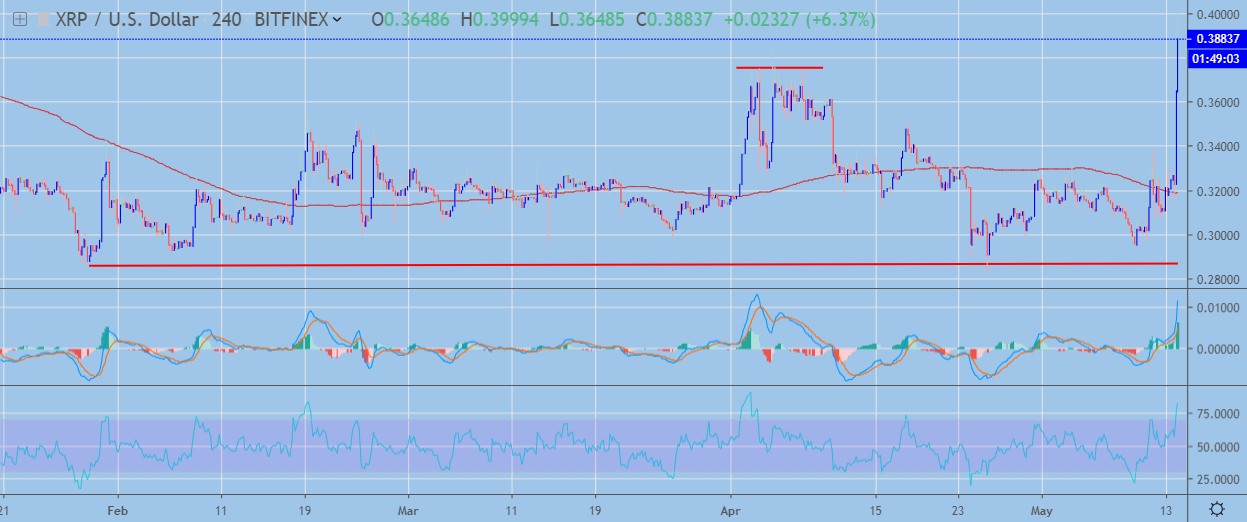 XRP / USD H4 Chart by TradingView
Pattern Watch
Traders should note that the 0.4600 level now offers the strongest form of short-term technical resistance, now that the bearish head and shoulders pattern has been invalidated.
Relative Strength Index
The RSI indicator is bullish on the four-hour time frame, although it has moved into extreme overbought territory.
MACD Indicator
The MACD indicator has turned bullish on the four-hour time frame and is still generating a buy signal.
Fundamental Analysis
XRP’s bullish momentum is supported by the announcement that Germany’s second-biggest stock exchange, Boerse Stuttgart, will be listing XRP exchange-traded notes (ETNs).
In addition, Coinbase has introduced XRP trading for New York residents, which may signify that a decision regarding its status as a security is more concrete (and positive).
This will likely increase awareness of the cryptocurrency for investors, and could generate additional interest in Ripple.
Ripple / USD Medium-term price analysis
Ripple has a bullish medium-term trading outlook, with the XRP / USD pair trading above its key 200-day moving average for the first time this year.
The daily time frame shows that a major bullish breakout has occurred, with the XRP / USD pair moving above a triangle pattern that has been in play for all of 2019.
Indicators on the daily time frame have turned bearish and show scope for further upside.
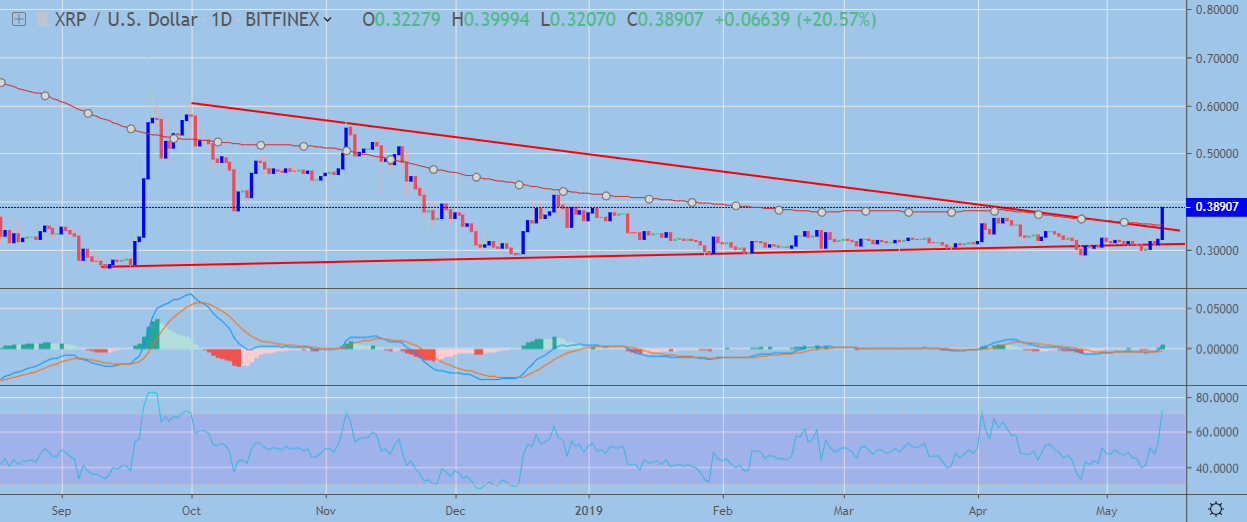 XRP / USD Daily Chart by TradingView
Pattern Watch
Traders should note that the overall upside protection of the bullish triangle pattern breakout would take the XRP / USD pair towards the 0.6000 level.
Relative Strength Index
The Relative Strength indicator on the daily time frame is bullish, although it is approaching overbought territory.
MACD Indicator
The MACD indicator on the daily time frame has turned bullish and shows scope for further upside.
Fundamental Analysis
Although Ripple continues to build partnerships with financial institutions around the world, its progress with adoption of xRapid is still quite slow. xRapid directly utilizes XRP for cross-border transaction payments, and its success or failure will have an immense impact on the value of the token.
Conclusion
Ripple has staged a strong technical reversal after previously languishing towards the worst trading levels of the year around the 0.3000 level.
Both the four-hour and daily time frame show bullish breakouts underway, with the 0.4600 and 0.6000 highlighted as initial upside target for the XRP / USD pair.
If you’re still confused about the basic difference between Ripple and XRP, so are we, our coin guide is perfect for you.
For a deeper assessment, head over to our Ripple DARE instead.