
XRP / USD Price Analysis: Flooded Market
Amid a general sell-off and a vast amount of company tokens sold over the quarter, the pair turned bearish.
- Ripple has a bearish short-term trading bias, with the cryptocurrency tumbling below its 200-period moving average
- The XRP / USD pair has a bearish medium-term trading outlook
- The daily time frame shows that a bearish technical breakout from a triangle pattern is currently underway
XRP / USD Short-term price analysis
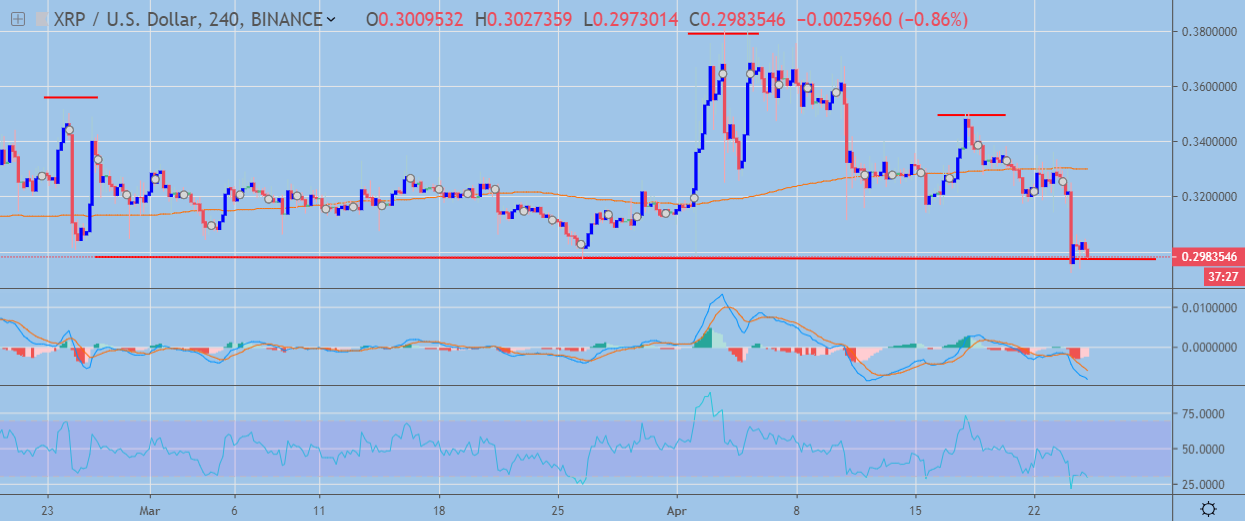
Ripple has a bearish short-term trading bias, with the XRP / USD pair tumbling below its 200-period moving average on the four-hour time frame.
The four-hour time frame is showing a large head and shoulders pattern, with XRP / USD sellers now testing towards the neckline of the bearish pattern.
Technical indicators across the four-hour time frame have turned heavily bearish and continue to signal further near-term losses.
 XRP / USD H4 Chart by TradingView
Pattern Watch
Traders should note that if the bearish head and shoulders pattern on the four-hour time frame is triggered, the XRP / USD pair could fall to a new 2019 trading low.
Relative Strength Index
The RSI indicator is bearish on the four-hour time frame, although the indicator is attempting to correct from oversold territory.
MACD Indicator
The MACD indicator has turned bearish on the four-hour time frame and is still generating a sell signal.
Fundamental Analysis
Over the past weeks XRP has been hampered by a number of negative catalysts. CTO David Schwartz has sold a share of his tokens, and the company also announced that it has increased the share of sold XRP by 31% in comparison to the previous quarter. With the current sell-off for alt coins, the increased supply of tokens has likely created additional downward pressure on the token price.
XRP / USD Medium-term price analysis
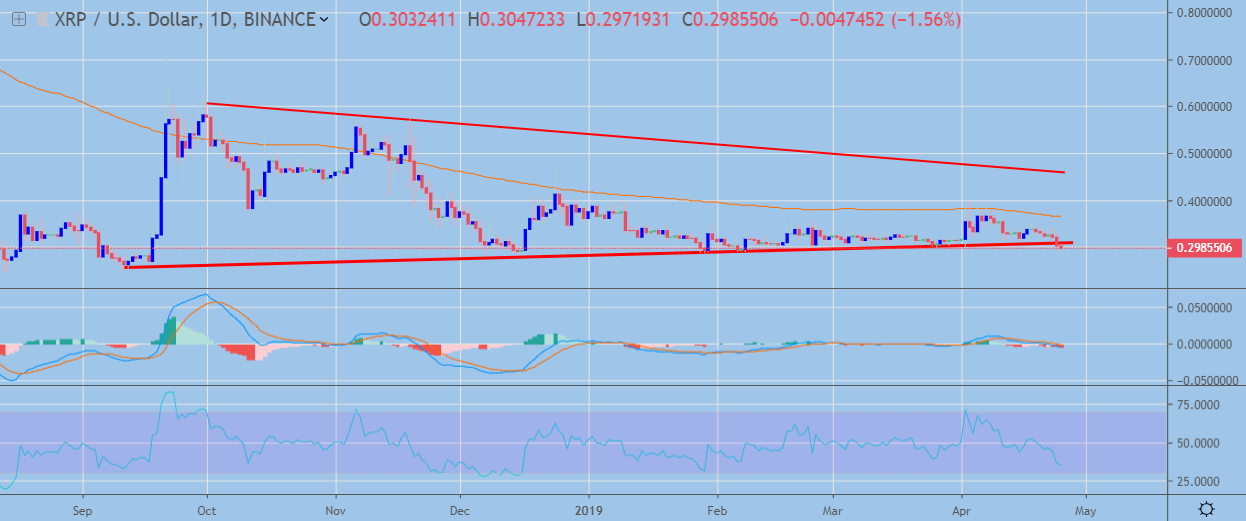
Ripple has a bearish medium-term trading outlook, with the XRP / USD pair falling to its weakest trading level since late January 2019.
The daily time frame shows that a bearish technical breakout is underway, with the XRP / USD pair now trading below a large triangle pattern that has been dominating the daily time frame this year.
Indicators on the daily time frame have turned bearish and show scope for further downside.
 XRP / USD Daily Chart by TradingView
Pattern Watch
Traders should note that the overall downside protection of the triangle pattern on the daily time frame is close to $20.00.
Relative Strength Index
The Relative Strength Index Indicator on the daily time frame has turned bearish and shows scope for further downside.
MACD Indicator
The MACD indicator on the daily time has turned bearish and is issuing a strong sell signal.
Fundamental Analysis
Although Ripple continues to expand its partner network, there is still little information on how the company is progressing with adoption of xRapid, which directly utilizes XRP for cross-border payments. The absence of positive news and development in this direction could have a negative effect on the value of the project.
Conclusion
Ripple has a bearish outlook across both time frames with the third largest cryptocurrency by market capitalization erasing all of its hard-earned gains from earlier this month.
The XRP / USD pair could come under significant pressure over the medium-term if the recent bearish triangle pattern breakout on the daily time frame is confirmed.
To get a quick refresher course on Ripple check out our coin guide here.
A deep dive look into XRP and Ripple Labs is available here.