 Earn with Nexo

XTZ / USD Price Analysis: Continuing Ascent
The pair continues its bullish run targeting higher price levels, but some indicators are appearing overstretched.
- Tezos has a strong short-term bullish bias, with the XTZ / USD pair continuing to make bullish higher highs
- The XTZ / USD pair also has a bullish medium-term trading bias
- A large inverted head and shoulders pattern is present across the daily time frame
XTZ / USD Short-term price analysis
Tezos has a bullish short-term trading bias, with the XTZ / USD pair advancing to its highest trading level since October 17th, 2018.
The four-hour time frame is showing a bullish breakout from a small triangle pattern, while the inverted head and shoulders pattern on the mentioned time frame has reached its upside target.
Technical indicators are rising on the four-hour time frame, although bearish MACD divergence has formed.
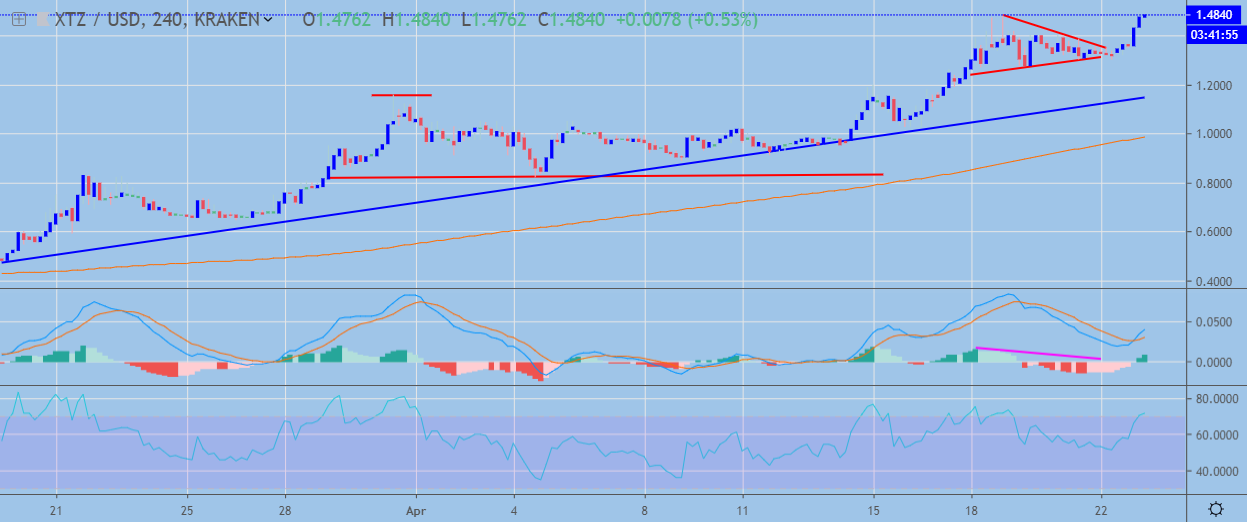 XTZ / USD H4 Chart by TradingView
Pattern Watch
Traders should note that the bullish triangle breakout underway on the four-hour time frame is encouraging near-term technical buying in the XTZ / USD pair.
Relative Strength Index
The RSI indicator remains bullish on the four-hour time frame, although it is approaching overbought territory.
MACD Indicator
The MACD indicator is bullish on the four-hour time frame, with the MACD signal line generating a strong buy signal.
XTZ / USD Medium-term price analysis
Tezos has a bullish medium-term trading outlook, with the XTZ / USD pair currently underpinned by strong buying demand.
The daily time frame is showing that a large inverted head and shoulders pattern has formed, with XTZ / USD bulls probing the neckline of the bullish pattern.
Technical indicators across the daily time frame are bullish, although they are starting to appear overstretched.
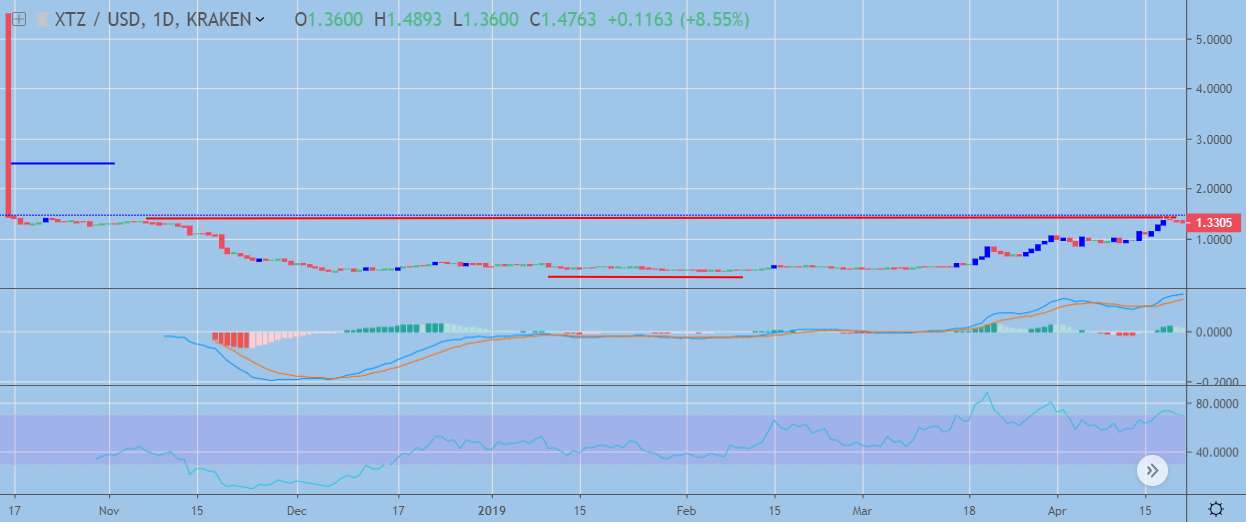 XTZ / USD Daily Chart by TradingView
Pattern Watch
Traders should note that the 2.500 level is the likely upside target of the large inverted head and shoulders pattern on the daily time frame.
Relative Strength Index
The Relative Strength Index is bullish on the daily time frame, although it is failing to make new highs alongside price.
MACD Indicator
The MACD indicator on the daily time frame is still generating a strong buy signal, although the MACD signal line appears overstretched.
Conclusion
Tezos retains a strong bullish bias over both time horizons, with the large inverted head and shoulders pattern on the daily time frame highlighting that further medium-term gains appear increasingly likely.
Traders should note, the presence of a bearish MACD price divergence on the four-hour time frame could prompt a minor technical correction lower in the XTZ / USD pair.
For a quick intro into Tezos, check out our coin guide.