
Shutterstock photo by Boris Rabtsevich
Yearn Could Steal DeFi Spotlight From Aave, Uniswap
Yearn Finance looks primed for gains while Uniswap and Aave trends could reverse.
Uniswap and Aave have enjoyed an impressive uptrend over the past few days, rising by more than 70% in market value. However, these DeFi tokens seem to have reached an exhaustion point while Yearn Finance looks primed to catch up with the bull run.
Uniswap Takes the Lead in DeFi’s Correction
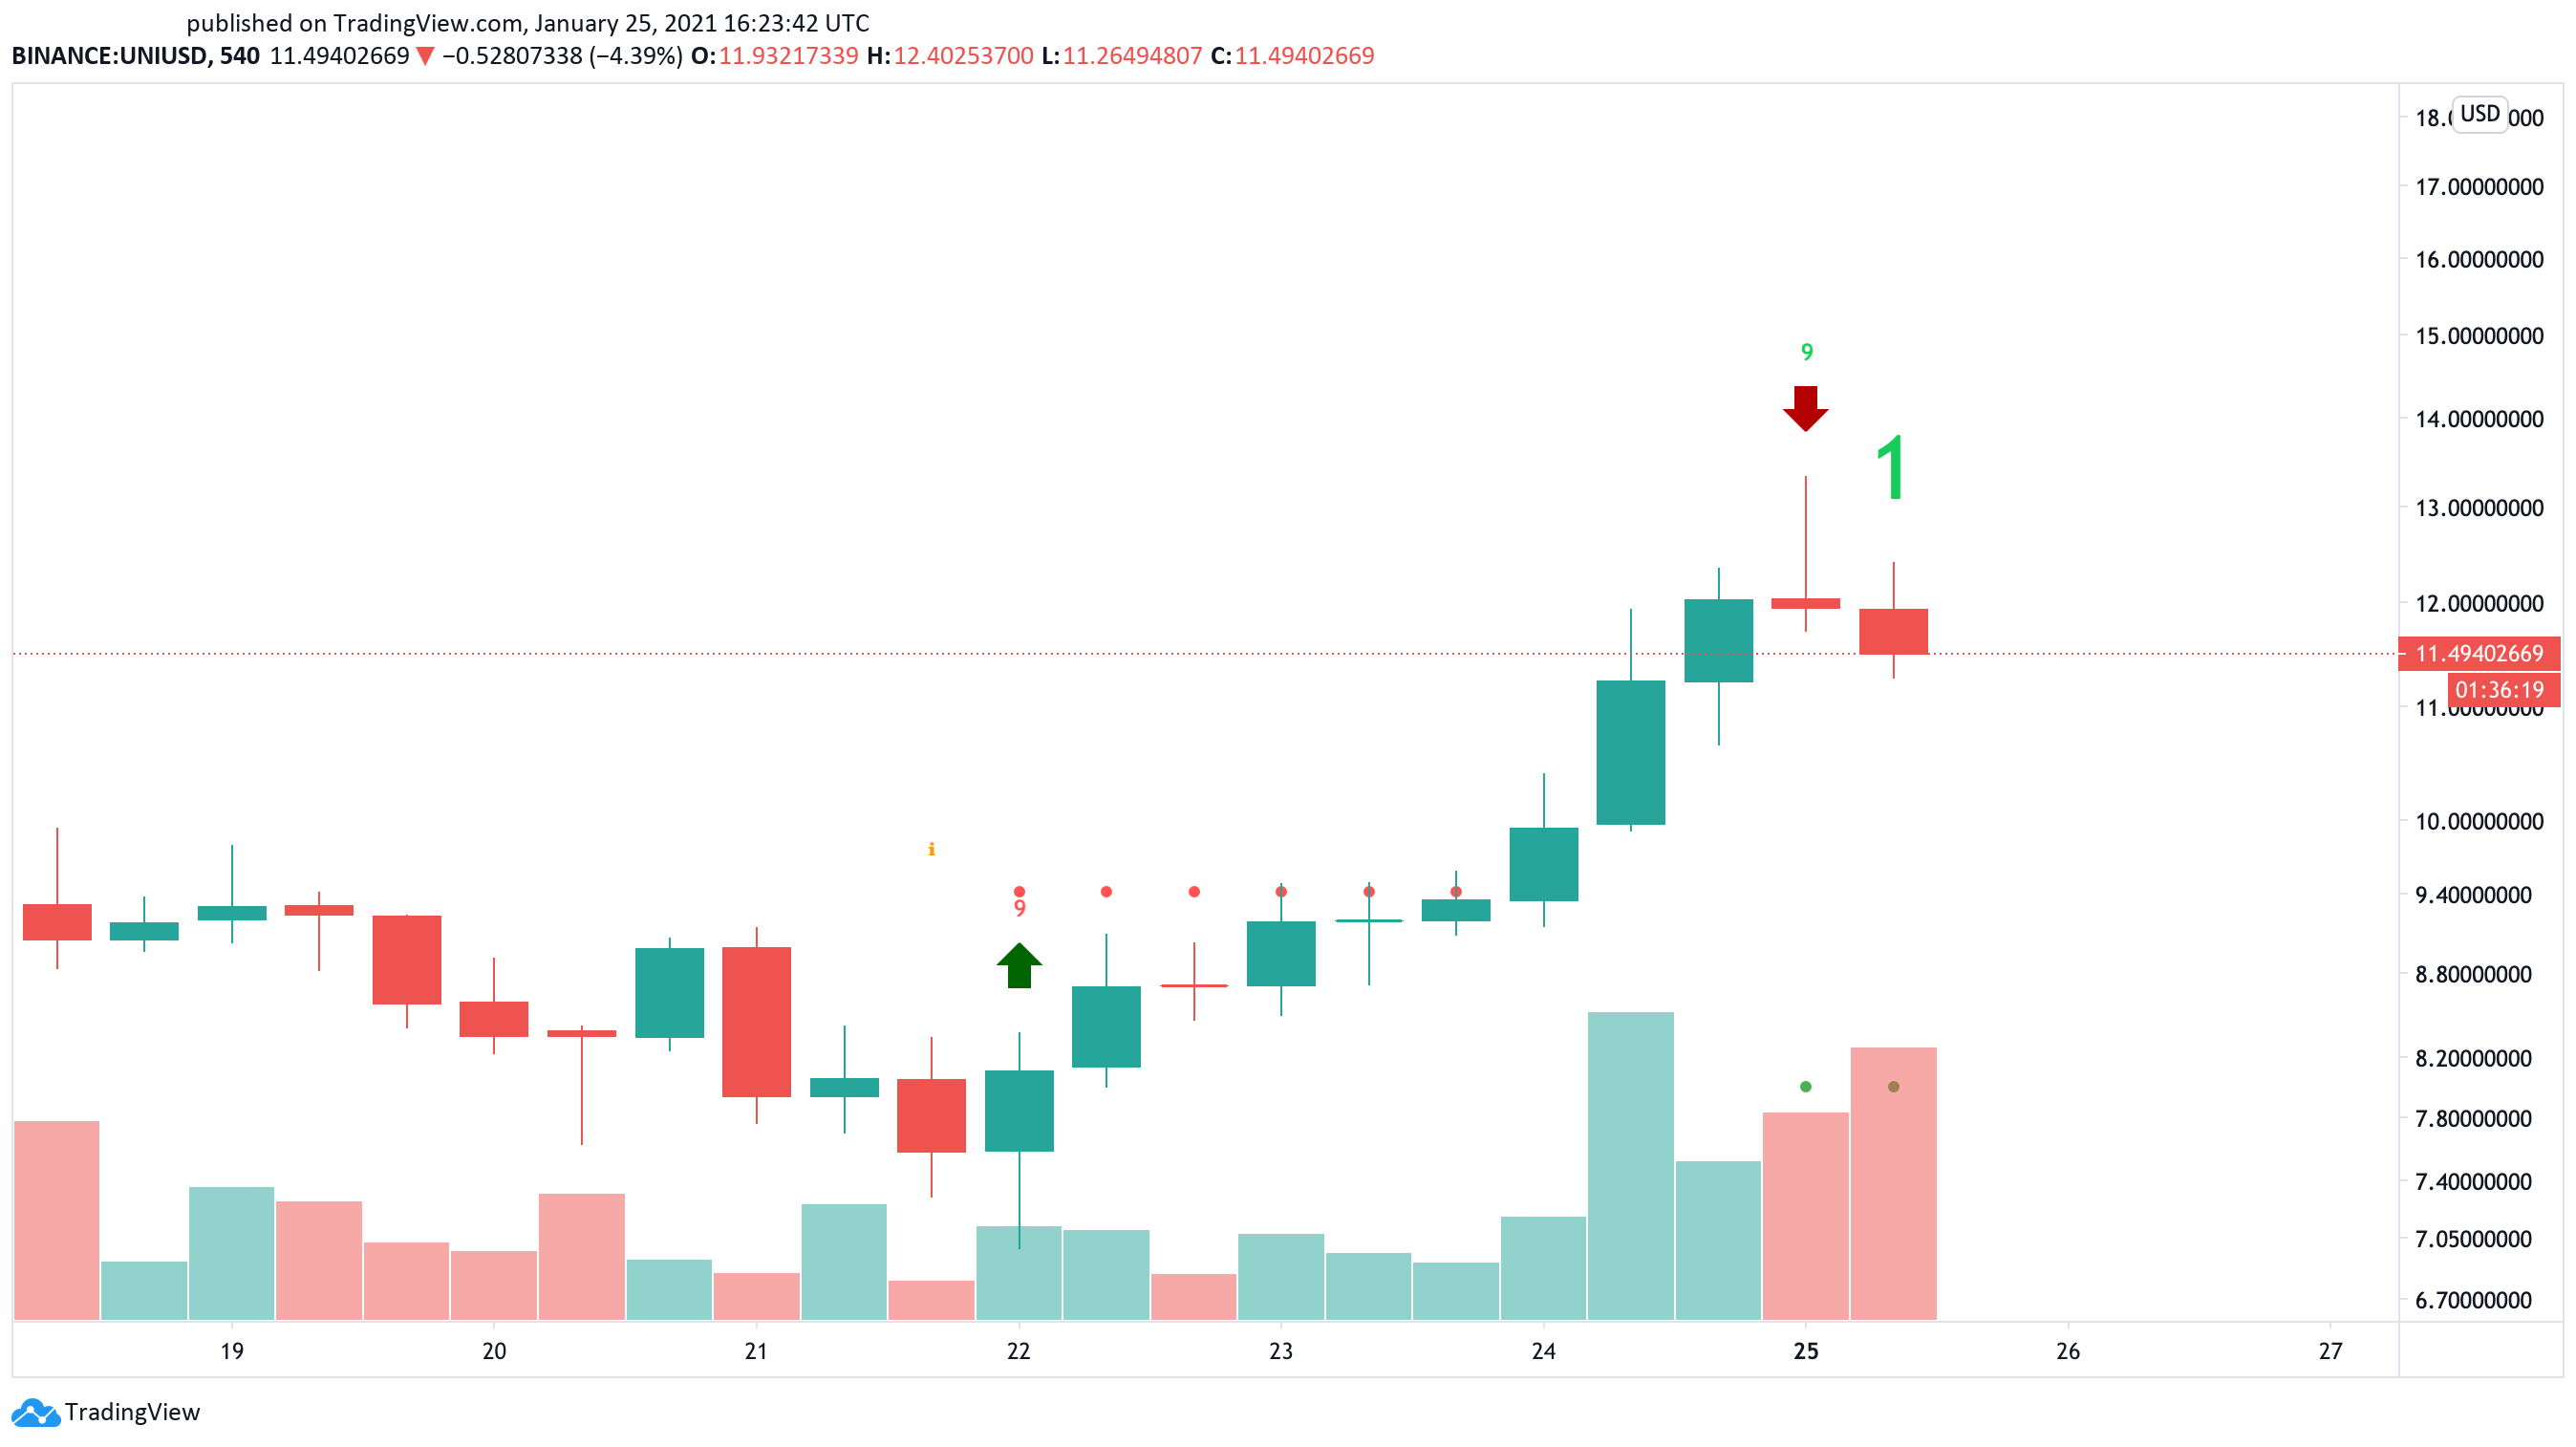
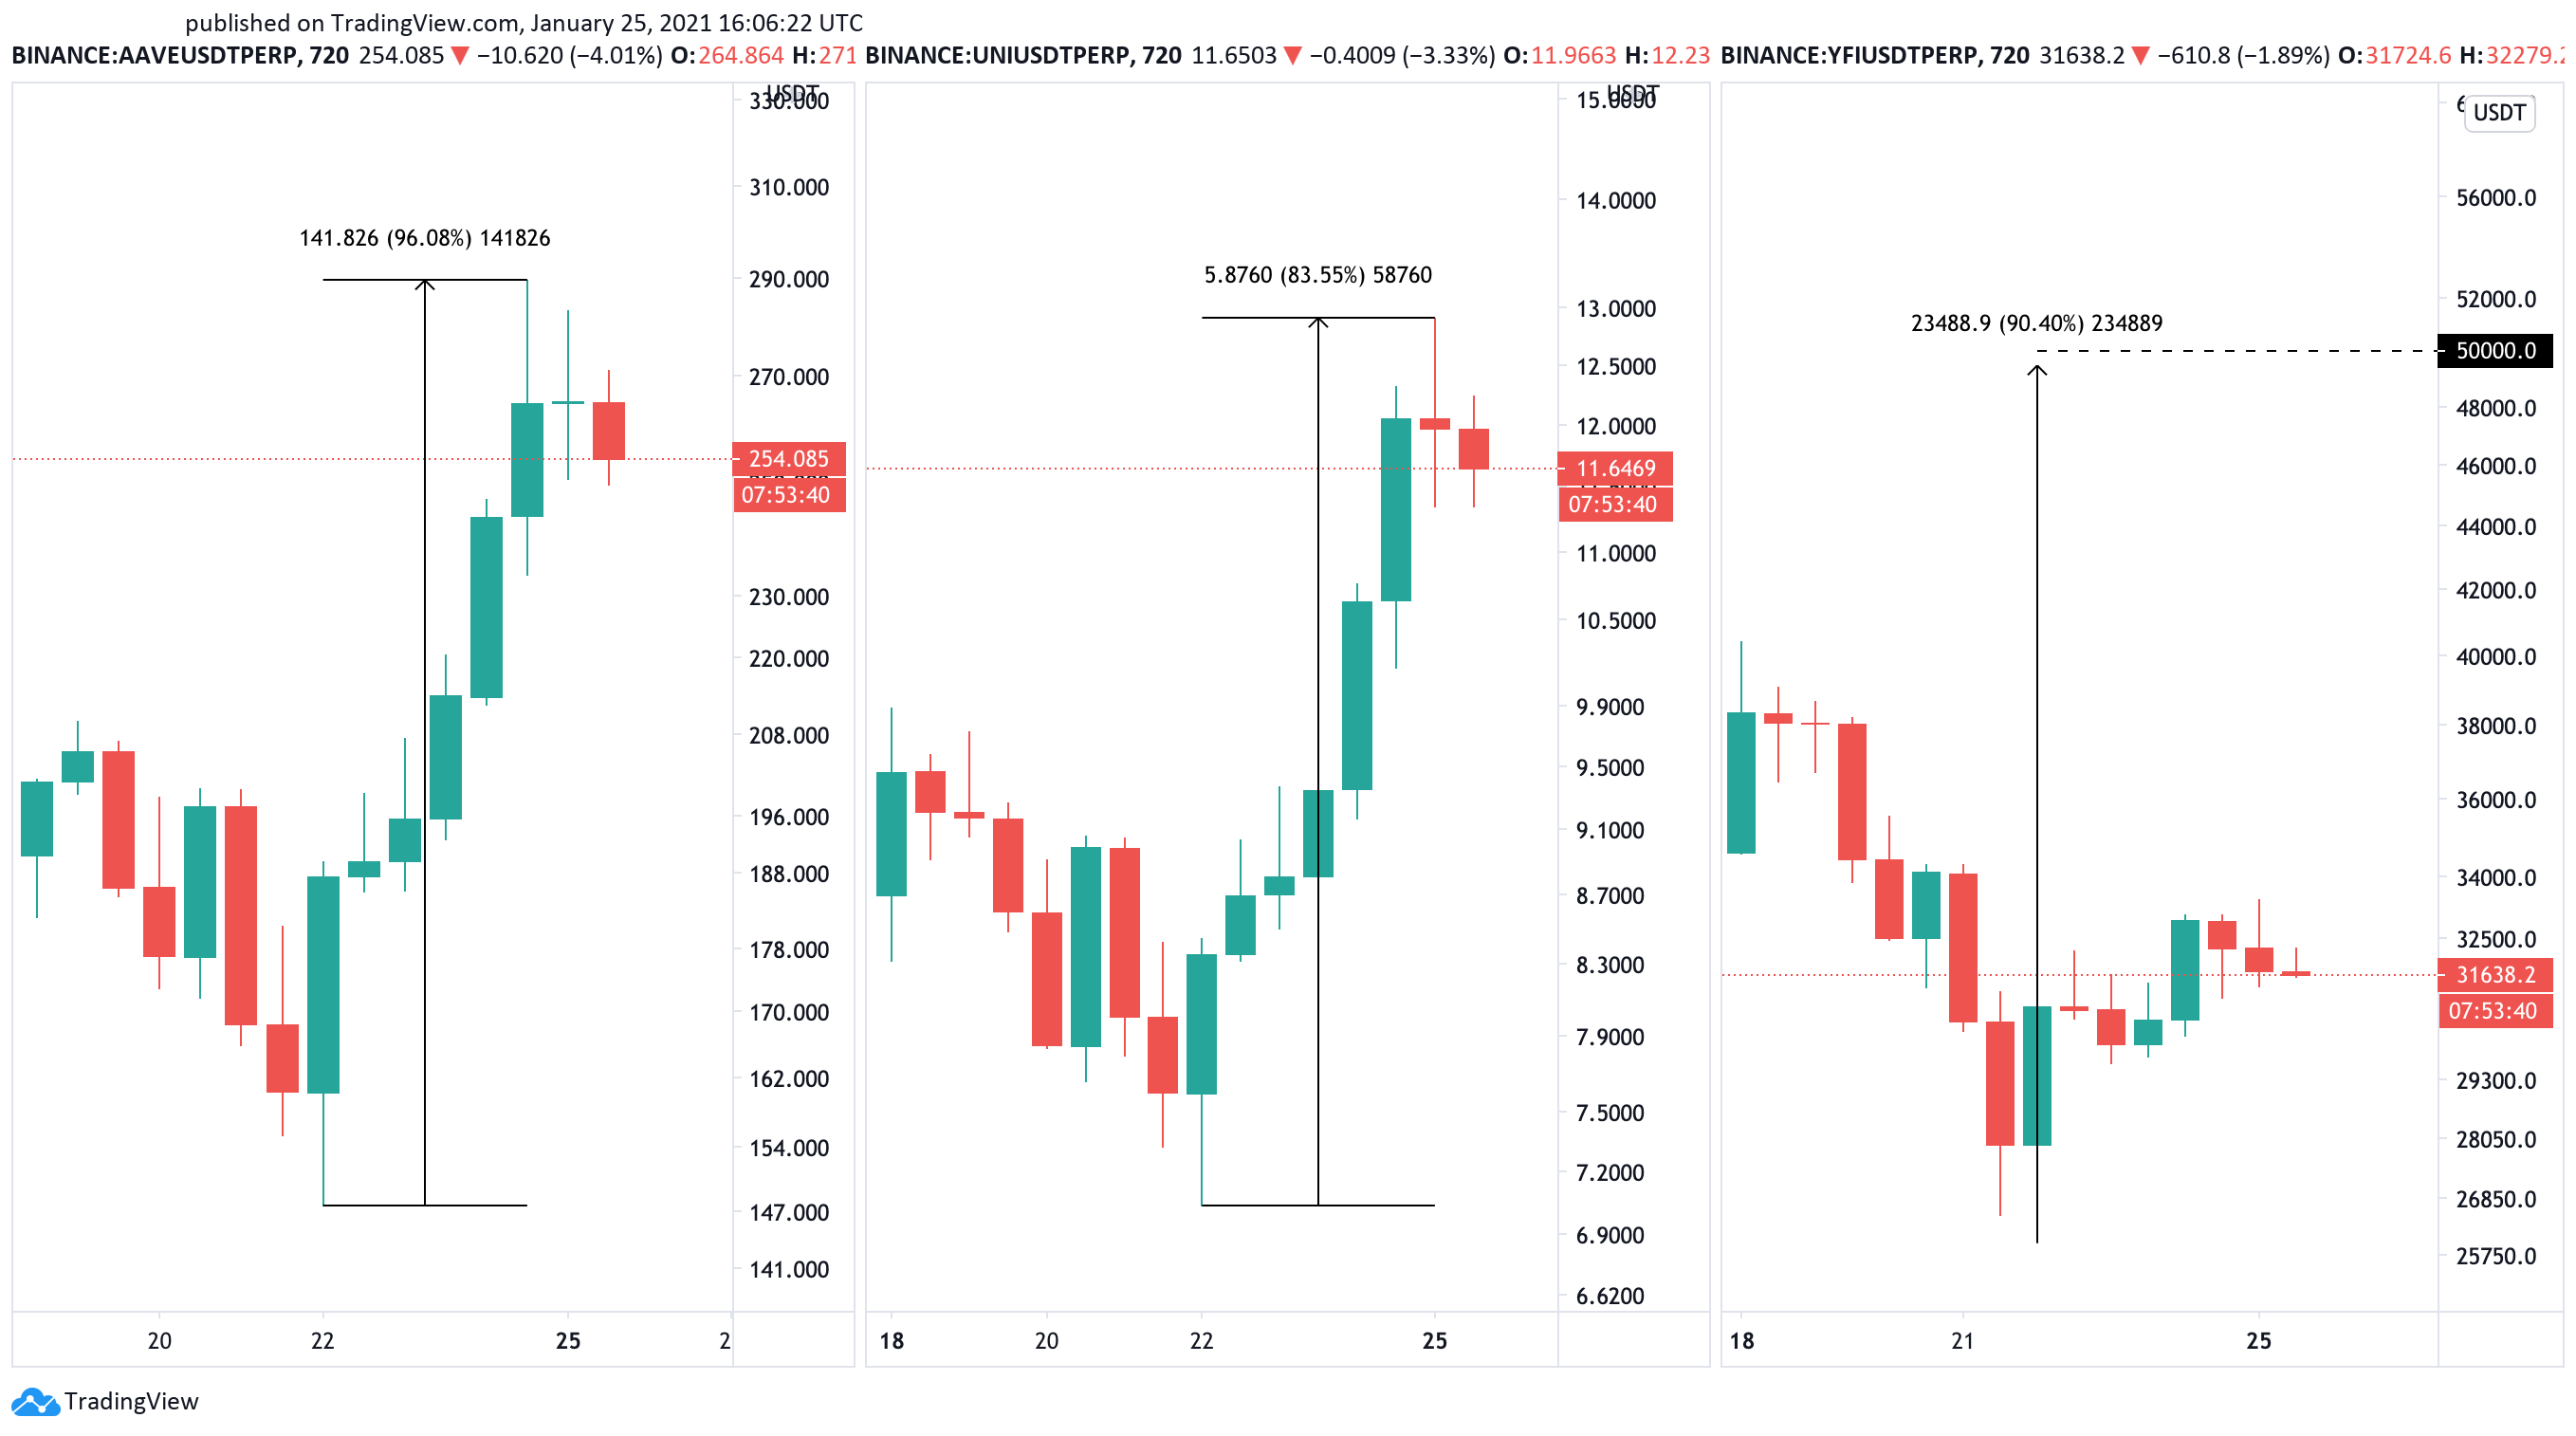
Uniswap has been on a roll lately as its token price skyrocketed by over 70% in the past three days. UNI went from opening at a low of $7.60 on Jan. 22 to reach a new all-time high of $13.30 recently.
Despite the massive gains incurred by UNI within such a short period, the Tom Demark (TD) Sequential indicator suggests that the cryptocurrency is hovering at overbought territory. That metric presents a sell signal on UNI’s 9-hour chart.
The bearish formation developed as a green nine candlestick, forecasting a one to four 9-hour candlesticks correction or the beginning of a new downward countdown.
A spike in selling pressure behind Uniswap may help validate the pessimistic outlook, regardless of the current uptrend’s strength.
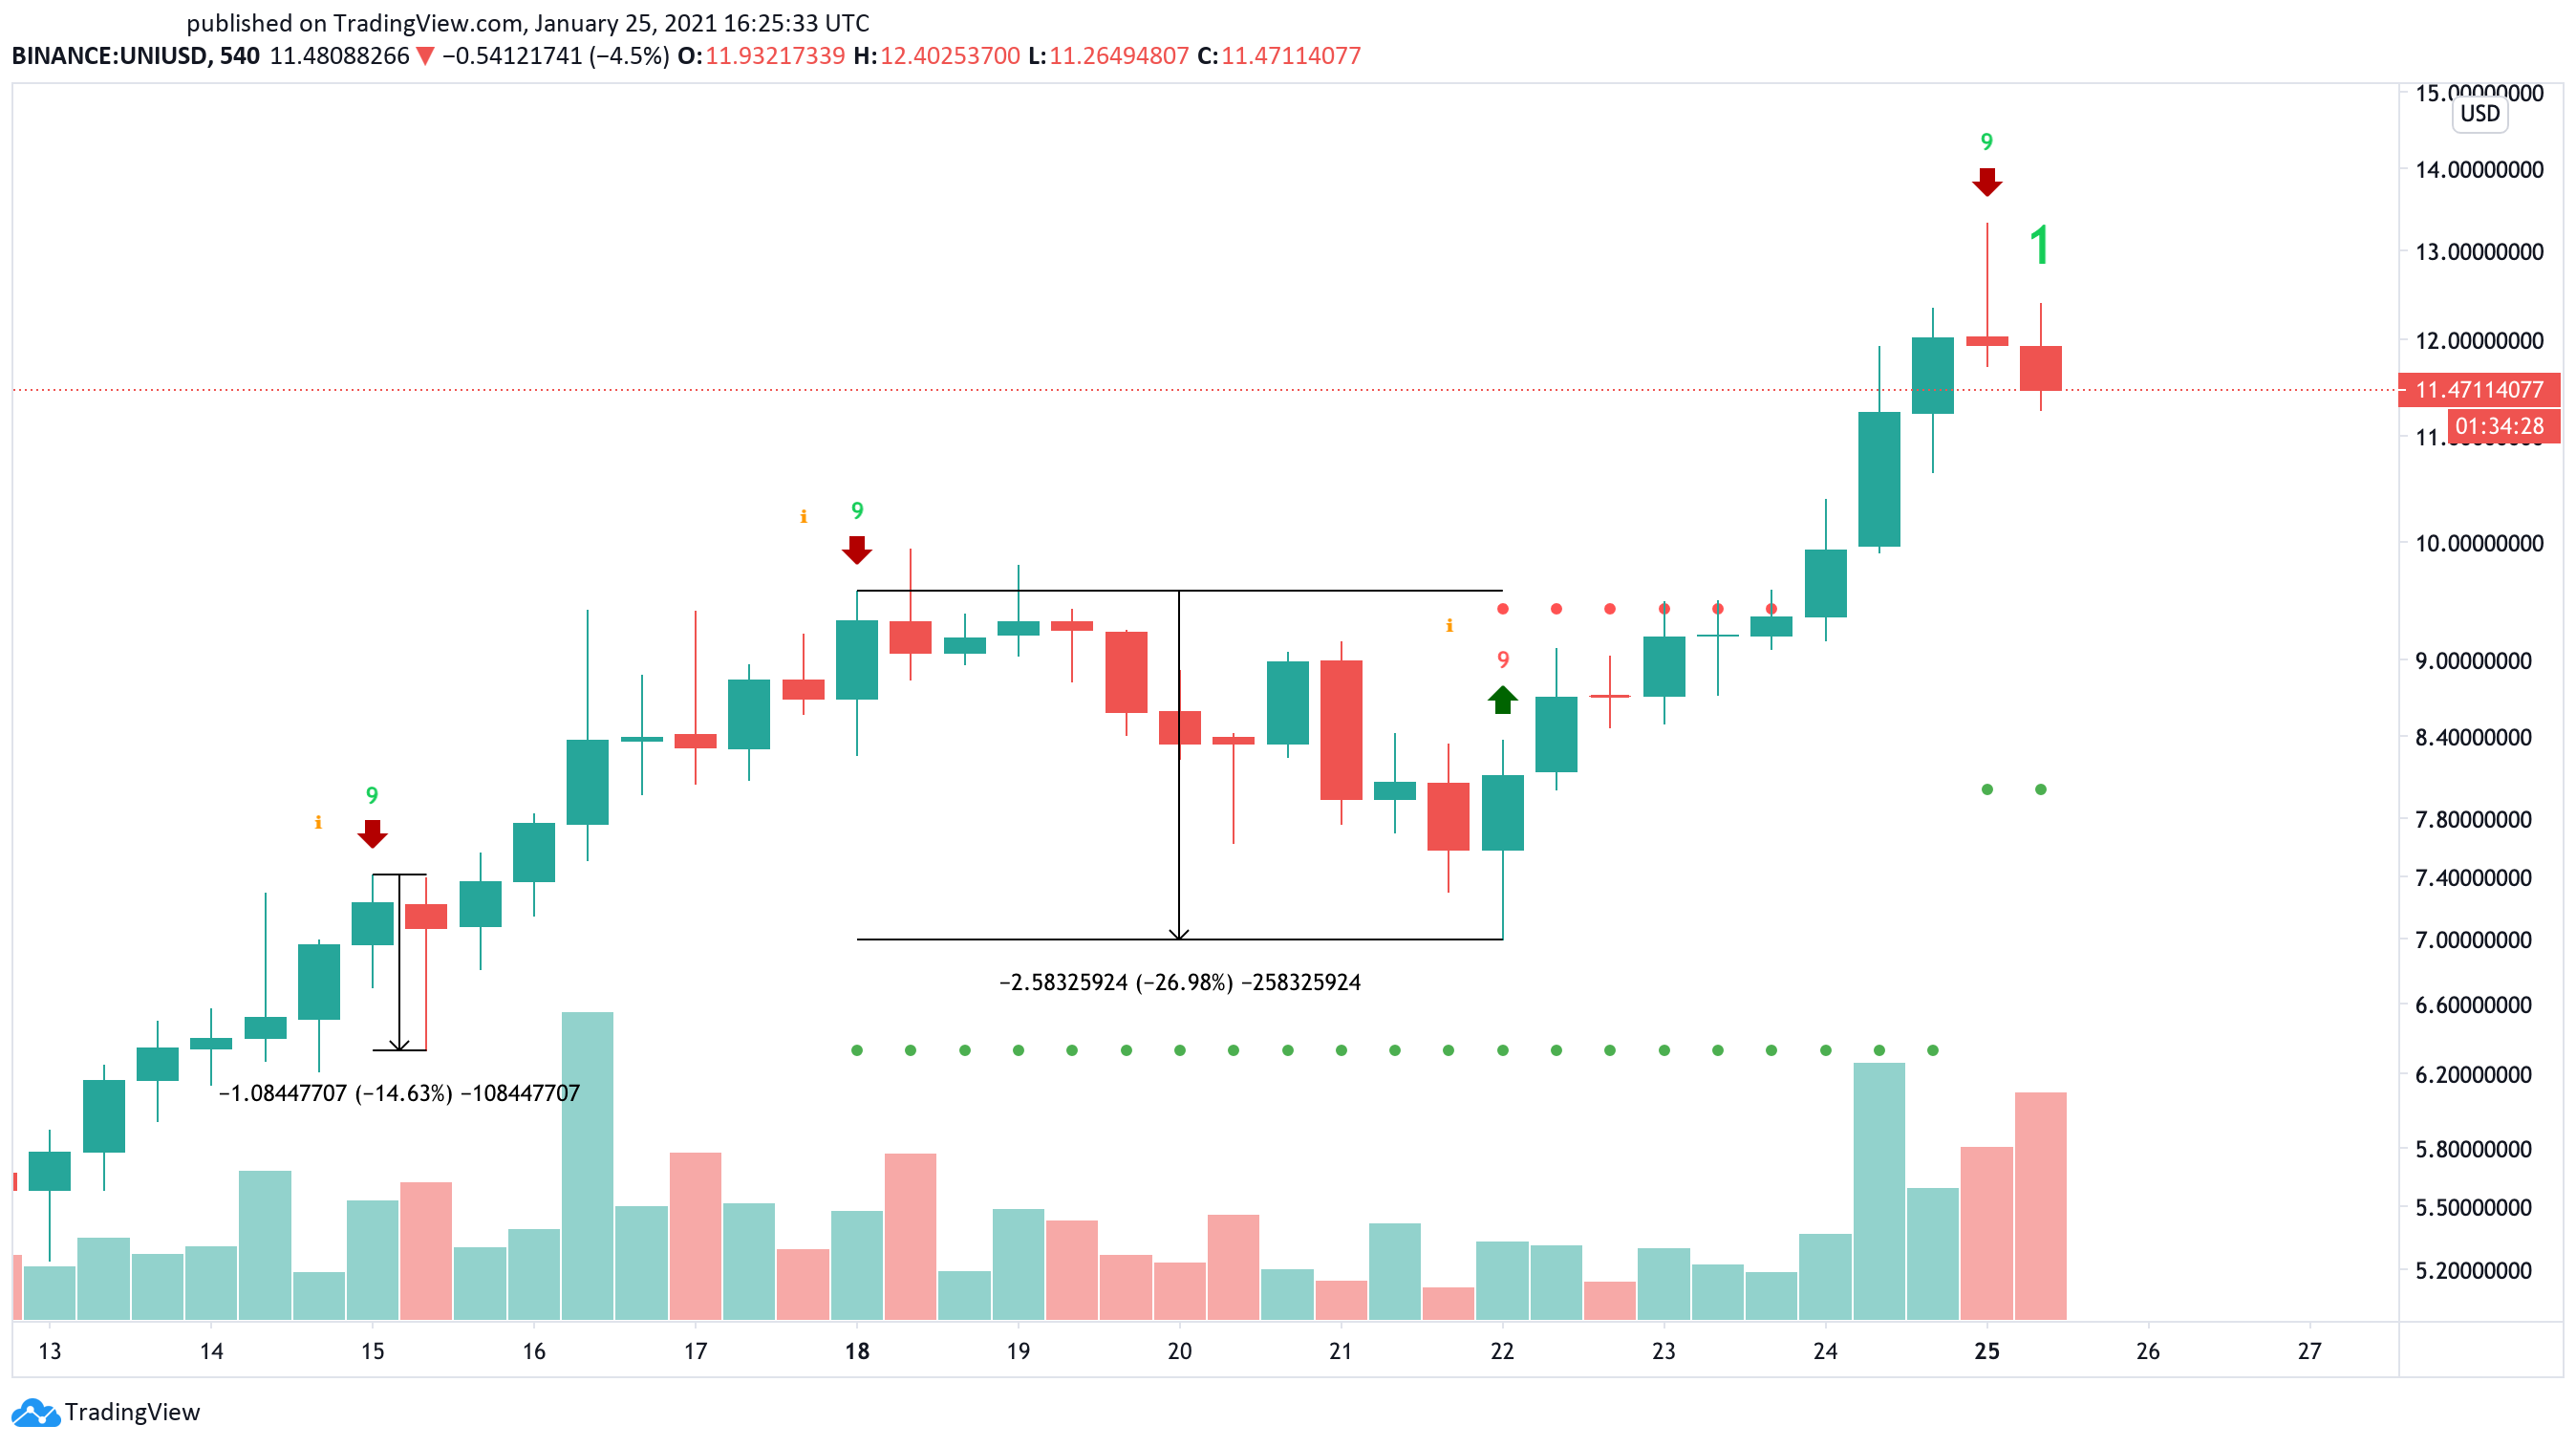
A glimpse at UNI’s 9-hour chart reveals that the TD setup has been incredibly accurate at anticipating local tops in its trend. The last two times that this technical index presented a sell signal within this timeframe over the past month, a steep correction followed.
Following a 55% rally between late Jan. 15 and Jan. 18, UNI took a 27% nosedive that was perfectly timed by the TD Sequential.
Therefore, the current pessimistic forecast must be considered even though Uniswap is still in price discovery mode.
If sell orders pile up around the current price levels pushing UNI below the $11 support level, a steeper decline will likely take place.
On its way down, the UNI token might find support around the 50% or 38.20% Fibonacci retracement level. These critical interest areas sit at $10.20 and $9.40, respectively.
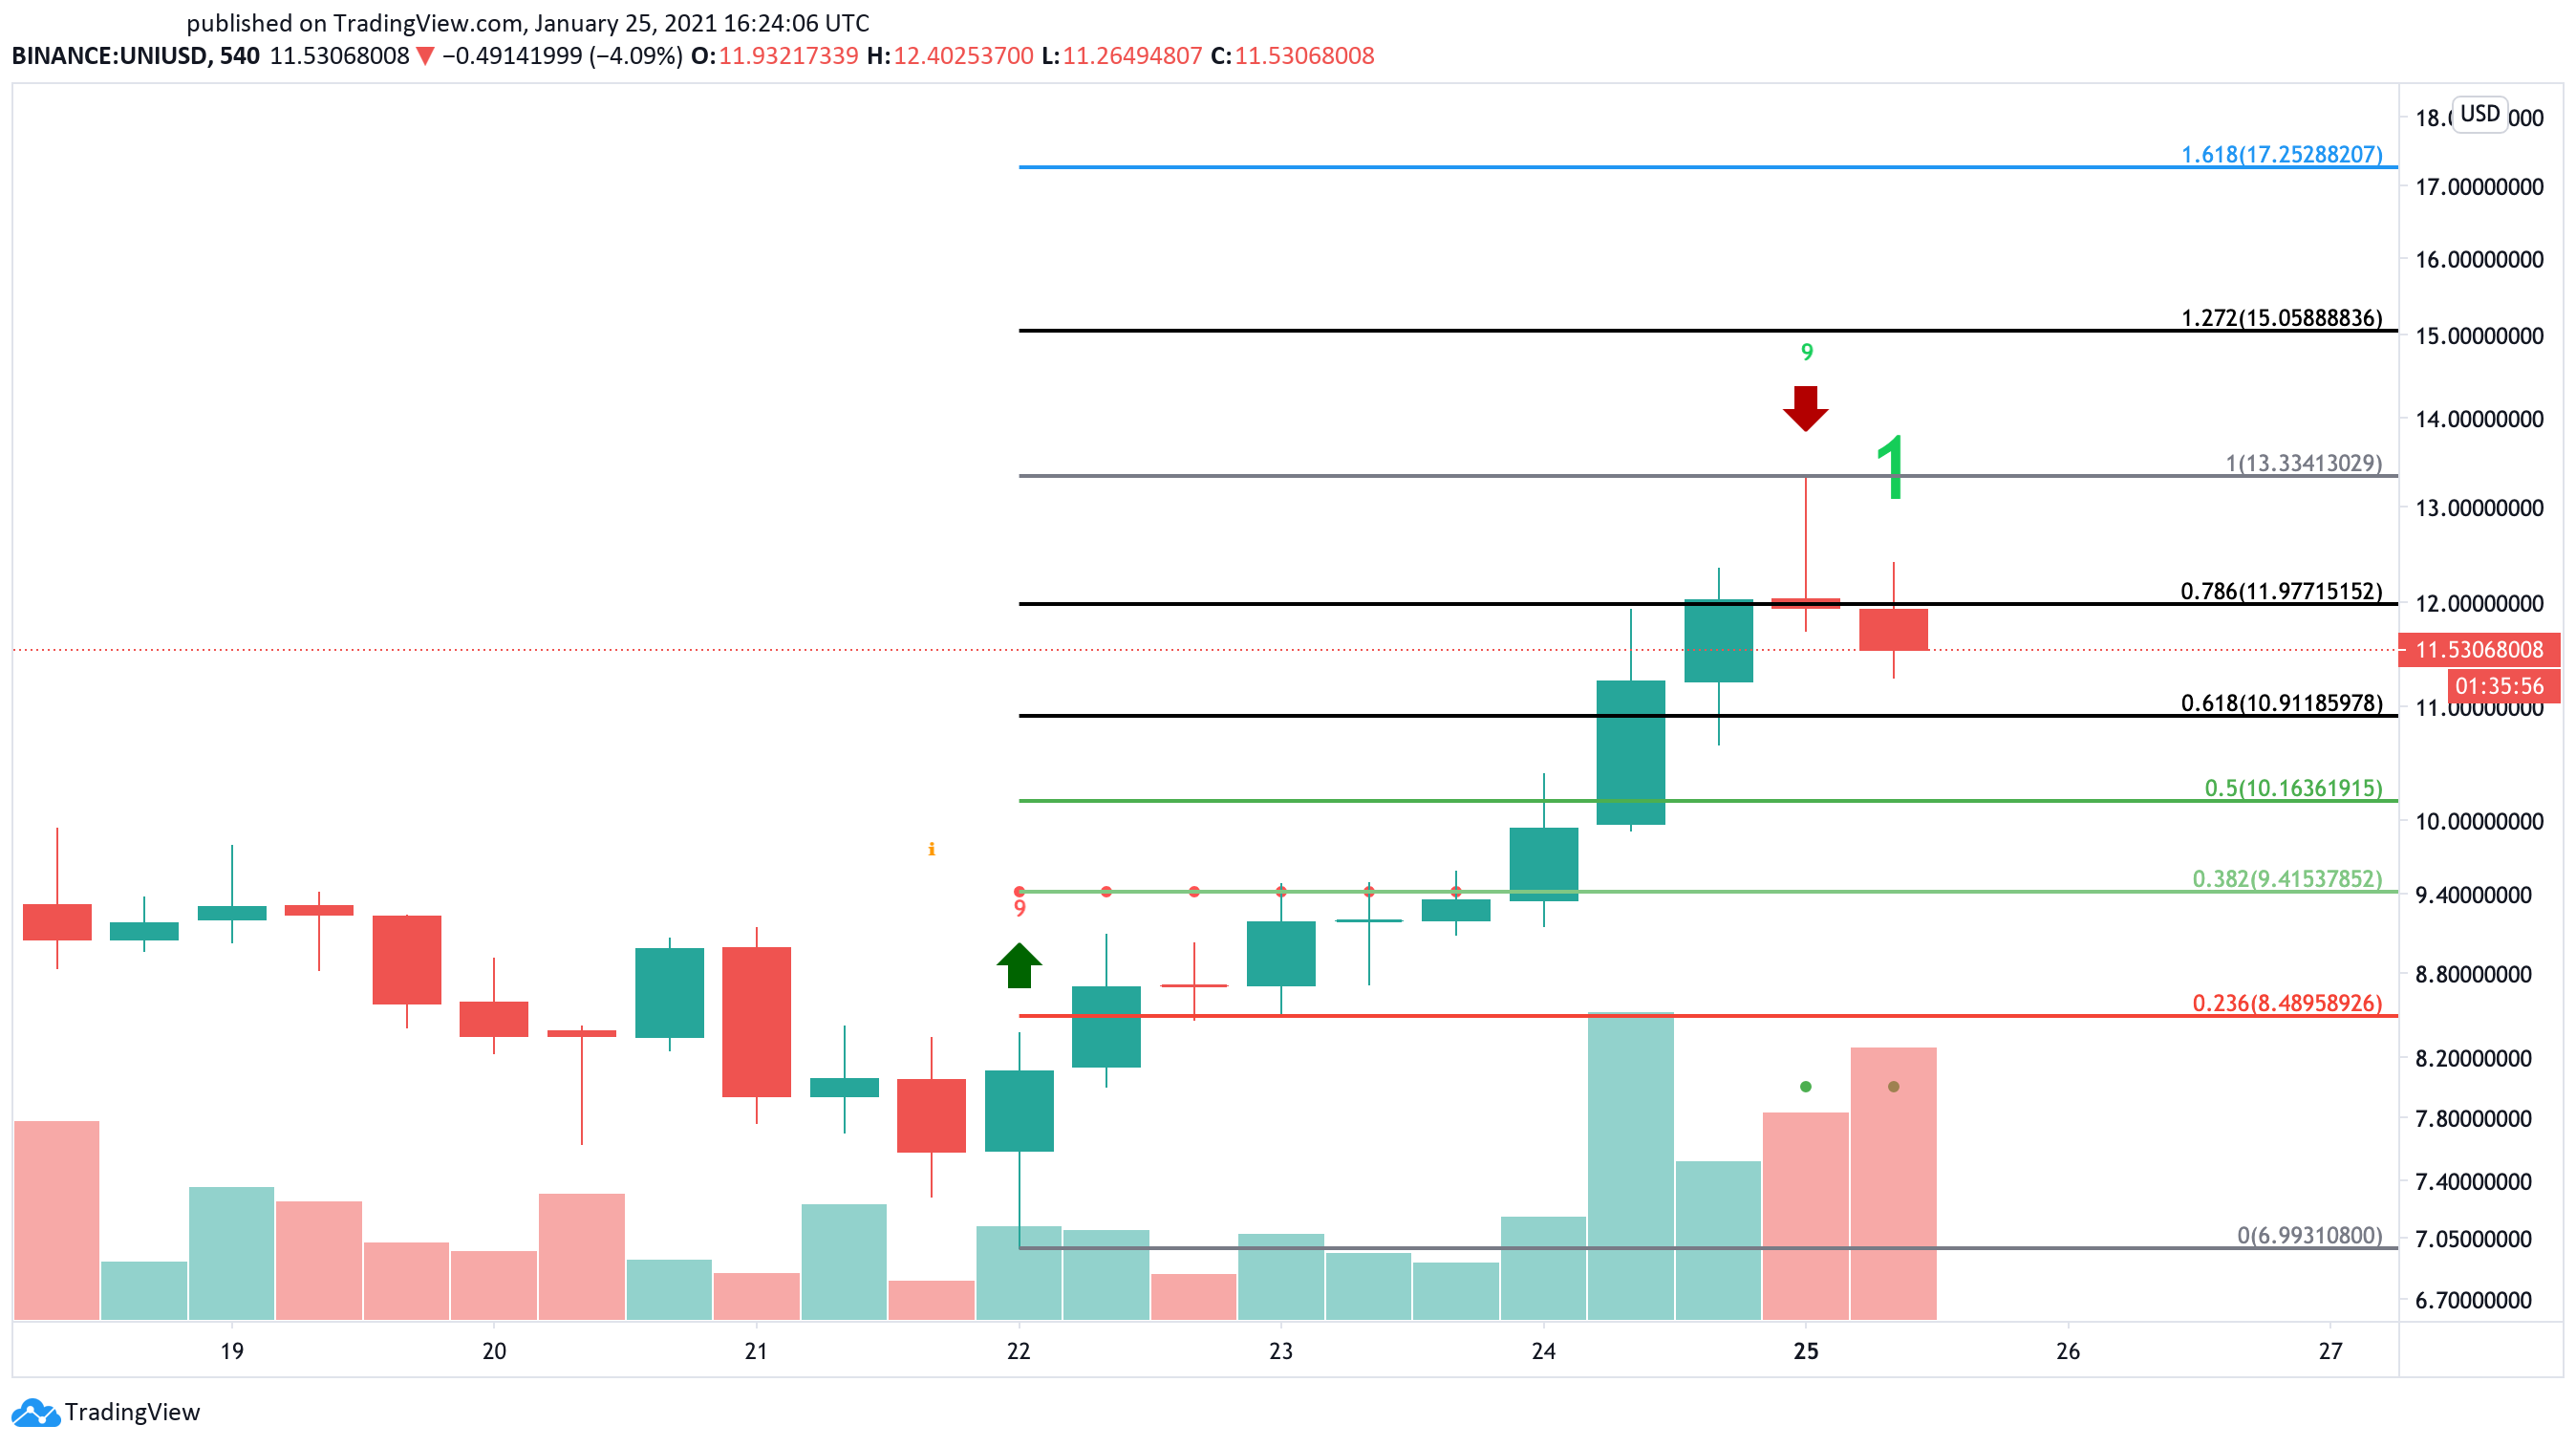
It is worth noting that if Uniswap slices through the overhead resistance barrier at $12 instead, the bearish outlook will be compromised. If this were to happen, this altcoin may re-test its recent all-time high of $13.30 and potentially move towards $15.
Aave Aims for a Steep Decline
Aave looks technically identical to Uniswap. Its price has risen by more than 80% since Jan. 22, going from a low of $160 on Jan. 22 to hit a new record high of $290 recently.
Given its high correlation with UNI token, the AAVE token also seems primed for a steep correction.
The TD Sequential flashed a sell signal in the form of a green nine candlestick on AAVE’s 3-day chart. If sell orders begin to pile up, the bearish formation would likely be validated, leading to a one to four 3-day candlesticks retracement before the uptrend resumes.
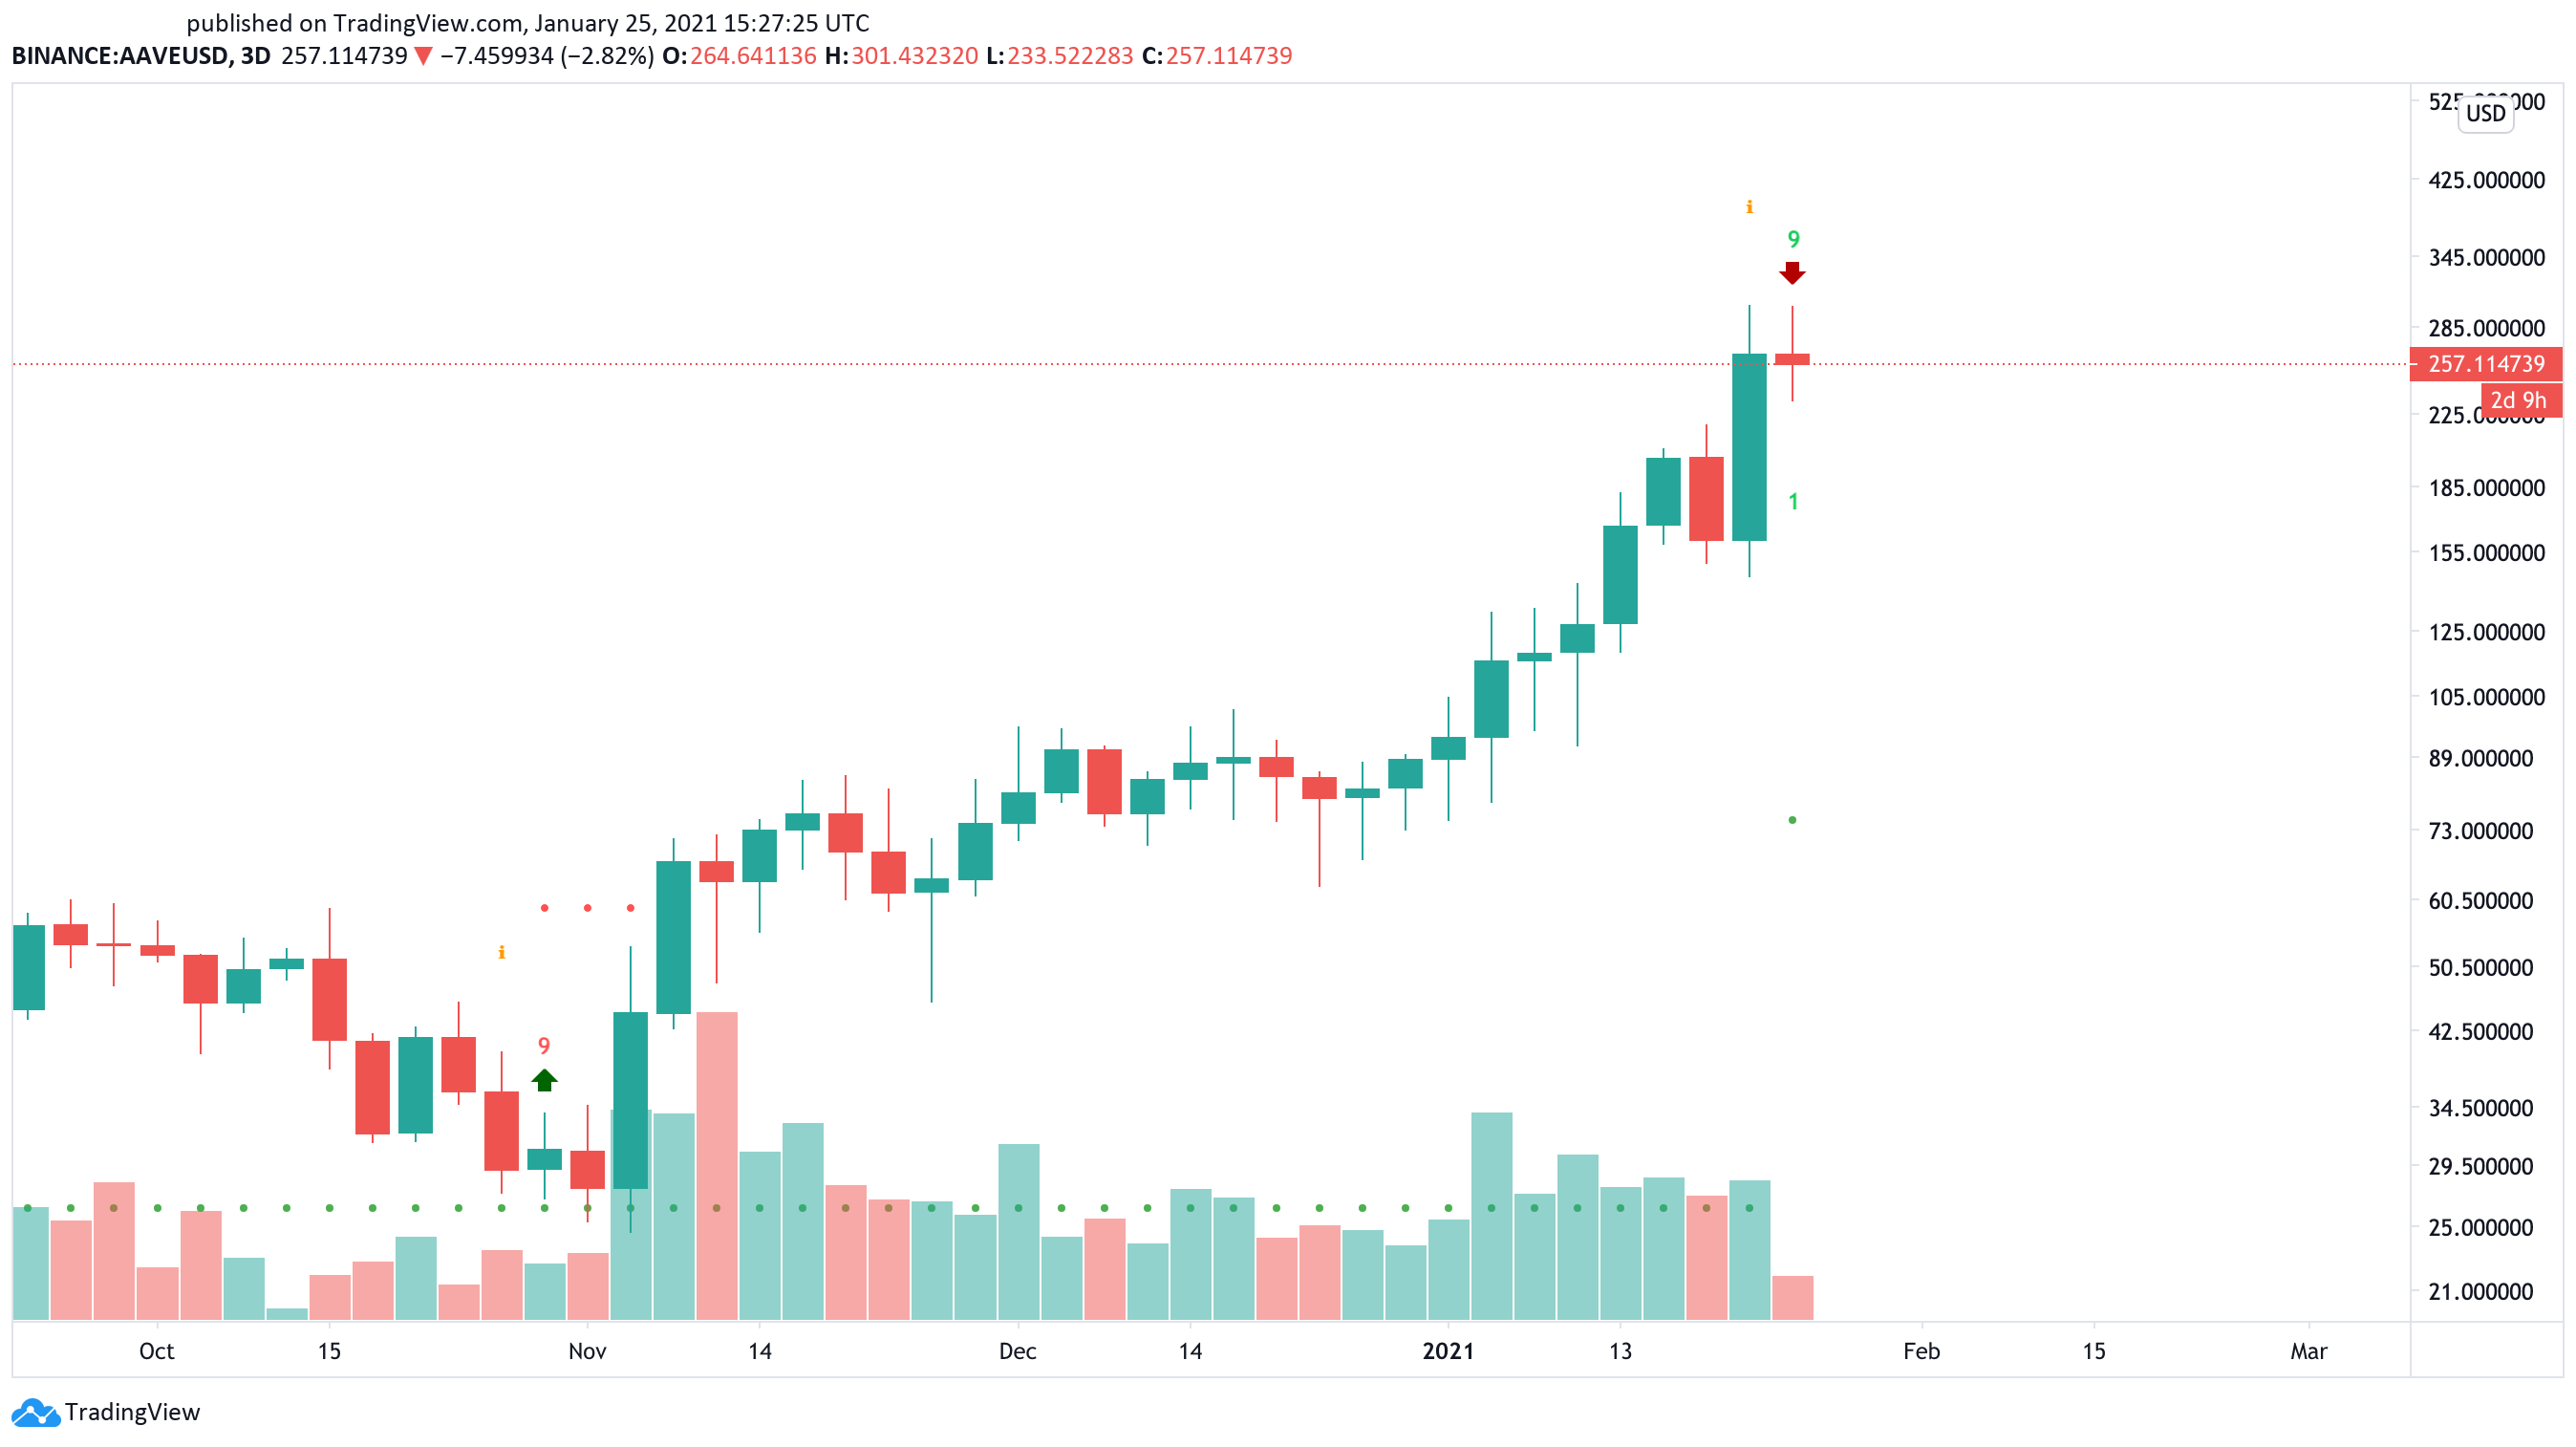
Based on historical data, the TD setup has been incredibly accurate at anticipating significant pullbacks ahead of AAVE. It even presented a sell signal in late August 2020, just before this altcoin saw its price plummet by nearly 73%.
Similar market behavior has occurred over the past year as all the sell signals presented by this technical index within the 3-day chart have been validated.
For this reason, it seems reasonable to take a precautionary approach when trading this cryptocurrency at the current price levels.
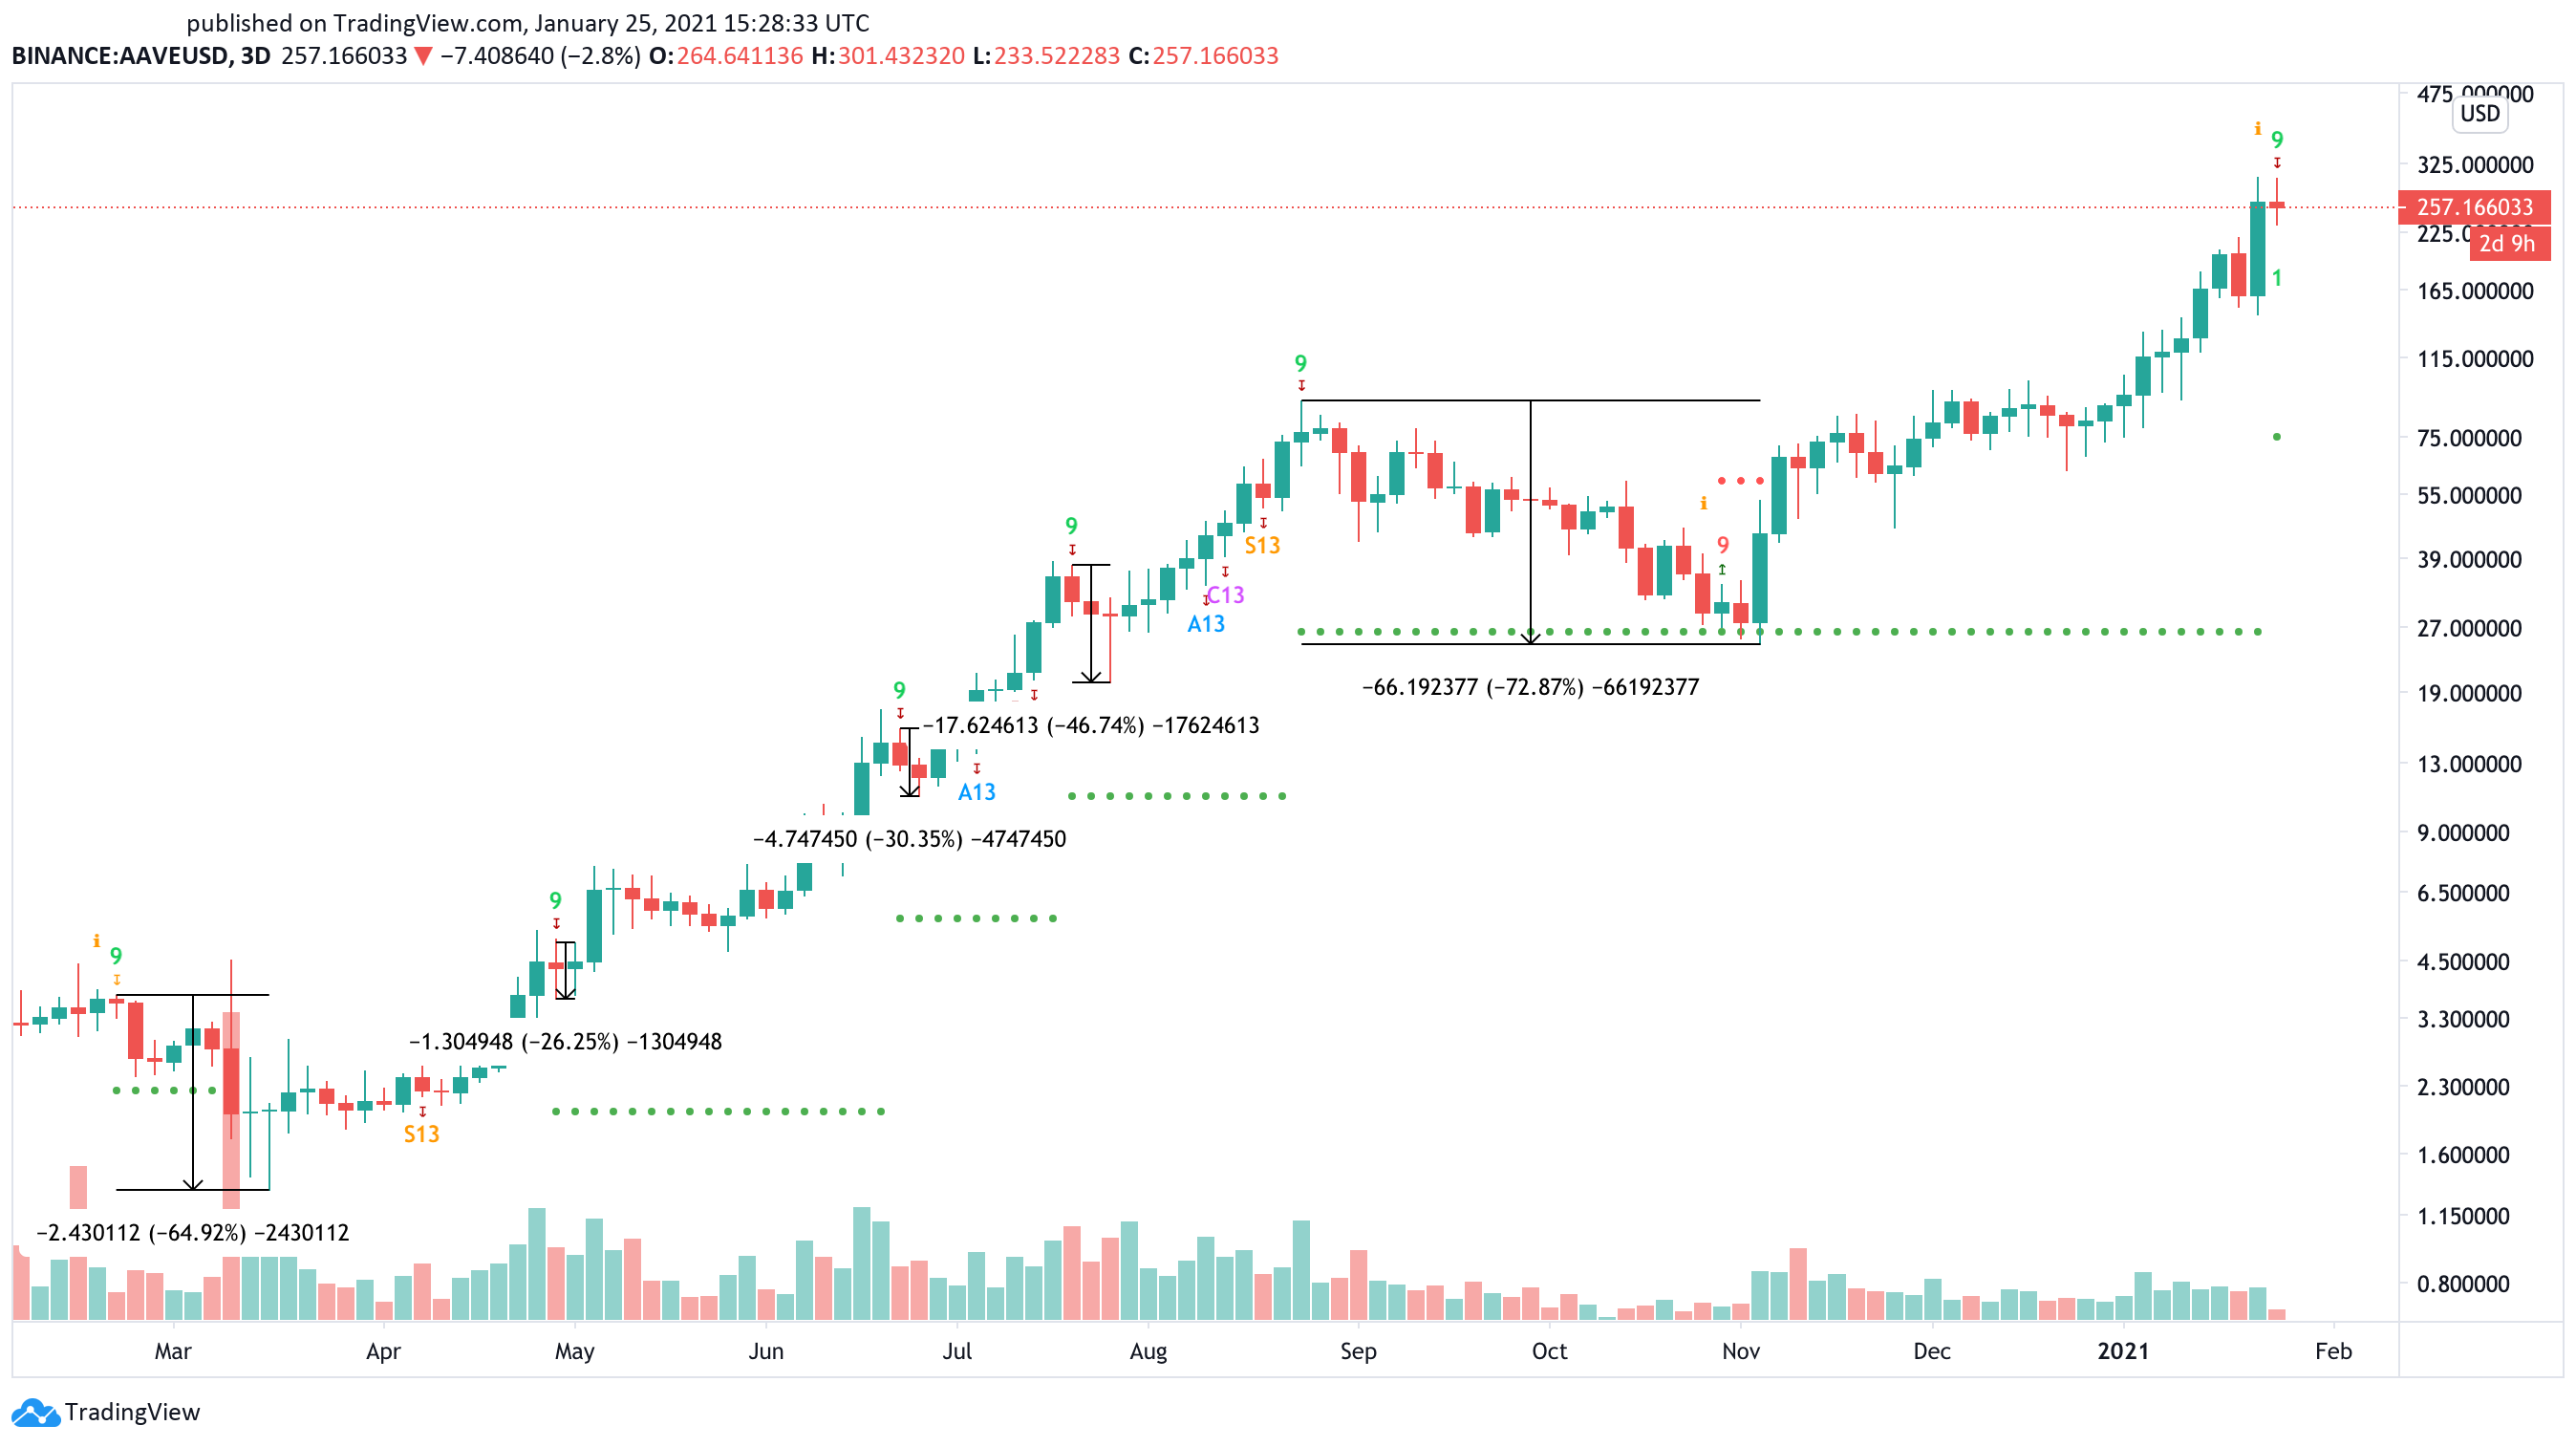
If a sell-off like the one seen in late August 2020 were to happen today, AAVE’s market value would crash towards $90. But for this to occur, it must first slice through three significant support areas based on the Fibonacci retracement indicator.
These critical price hurdles sit at $200, $160, and $130, respectively.
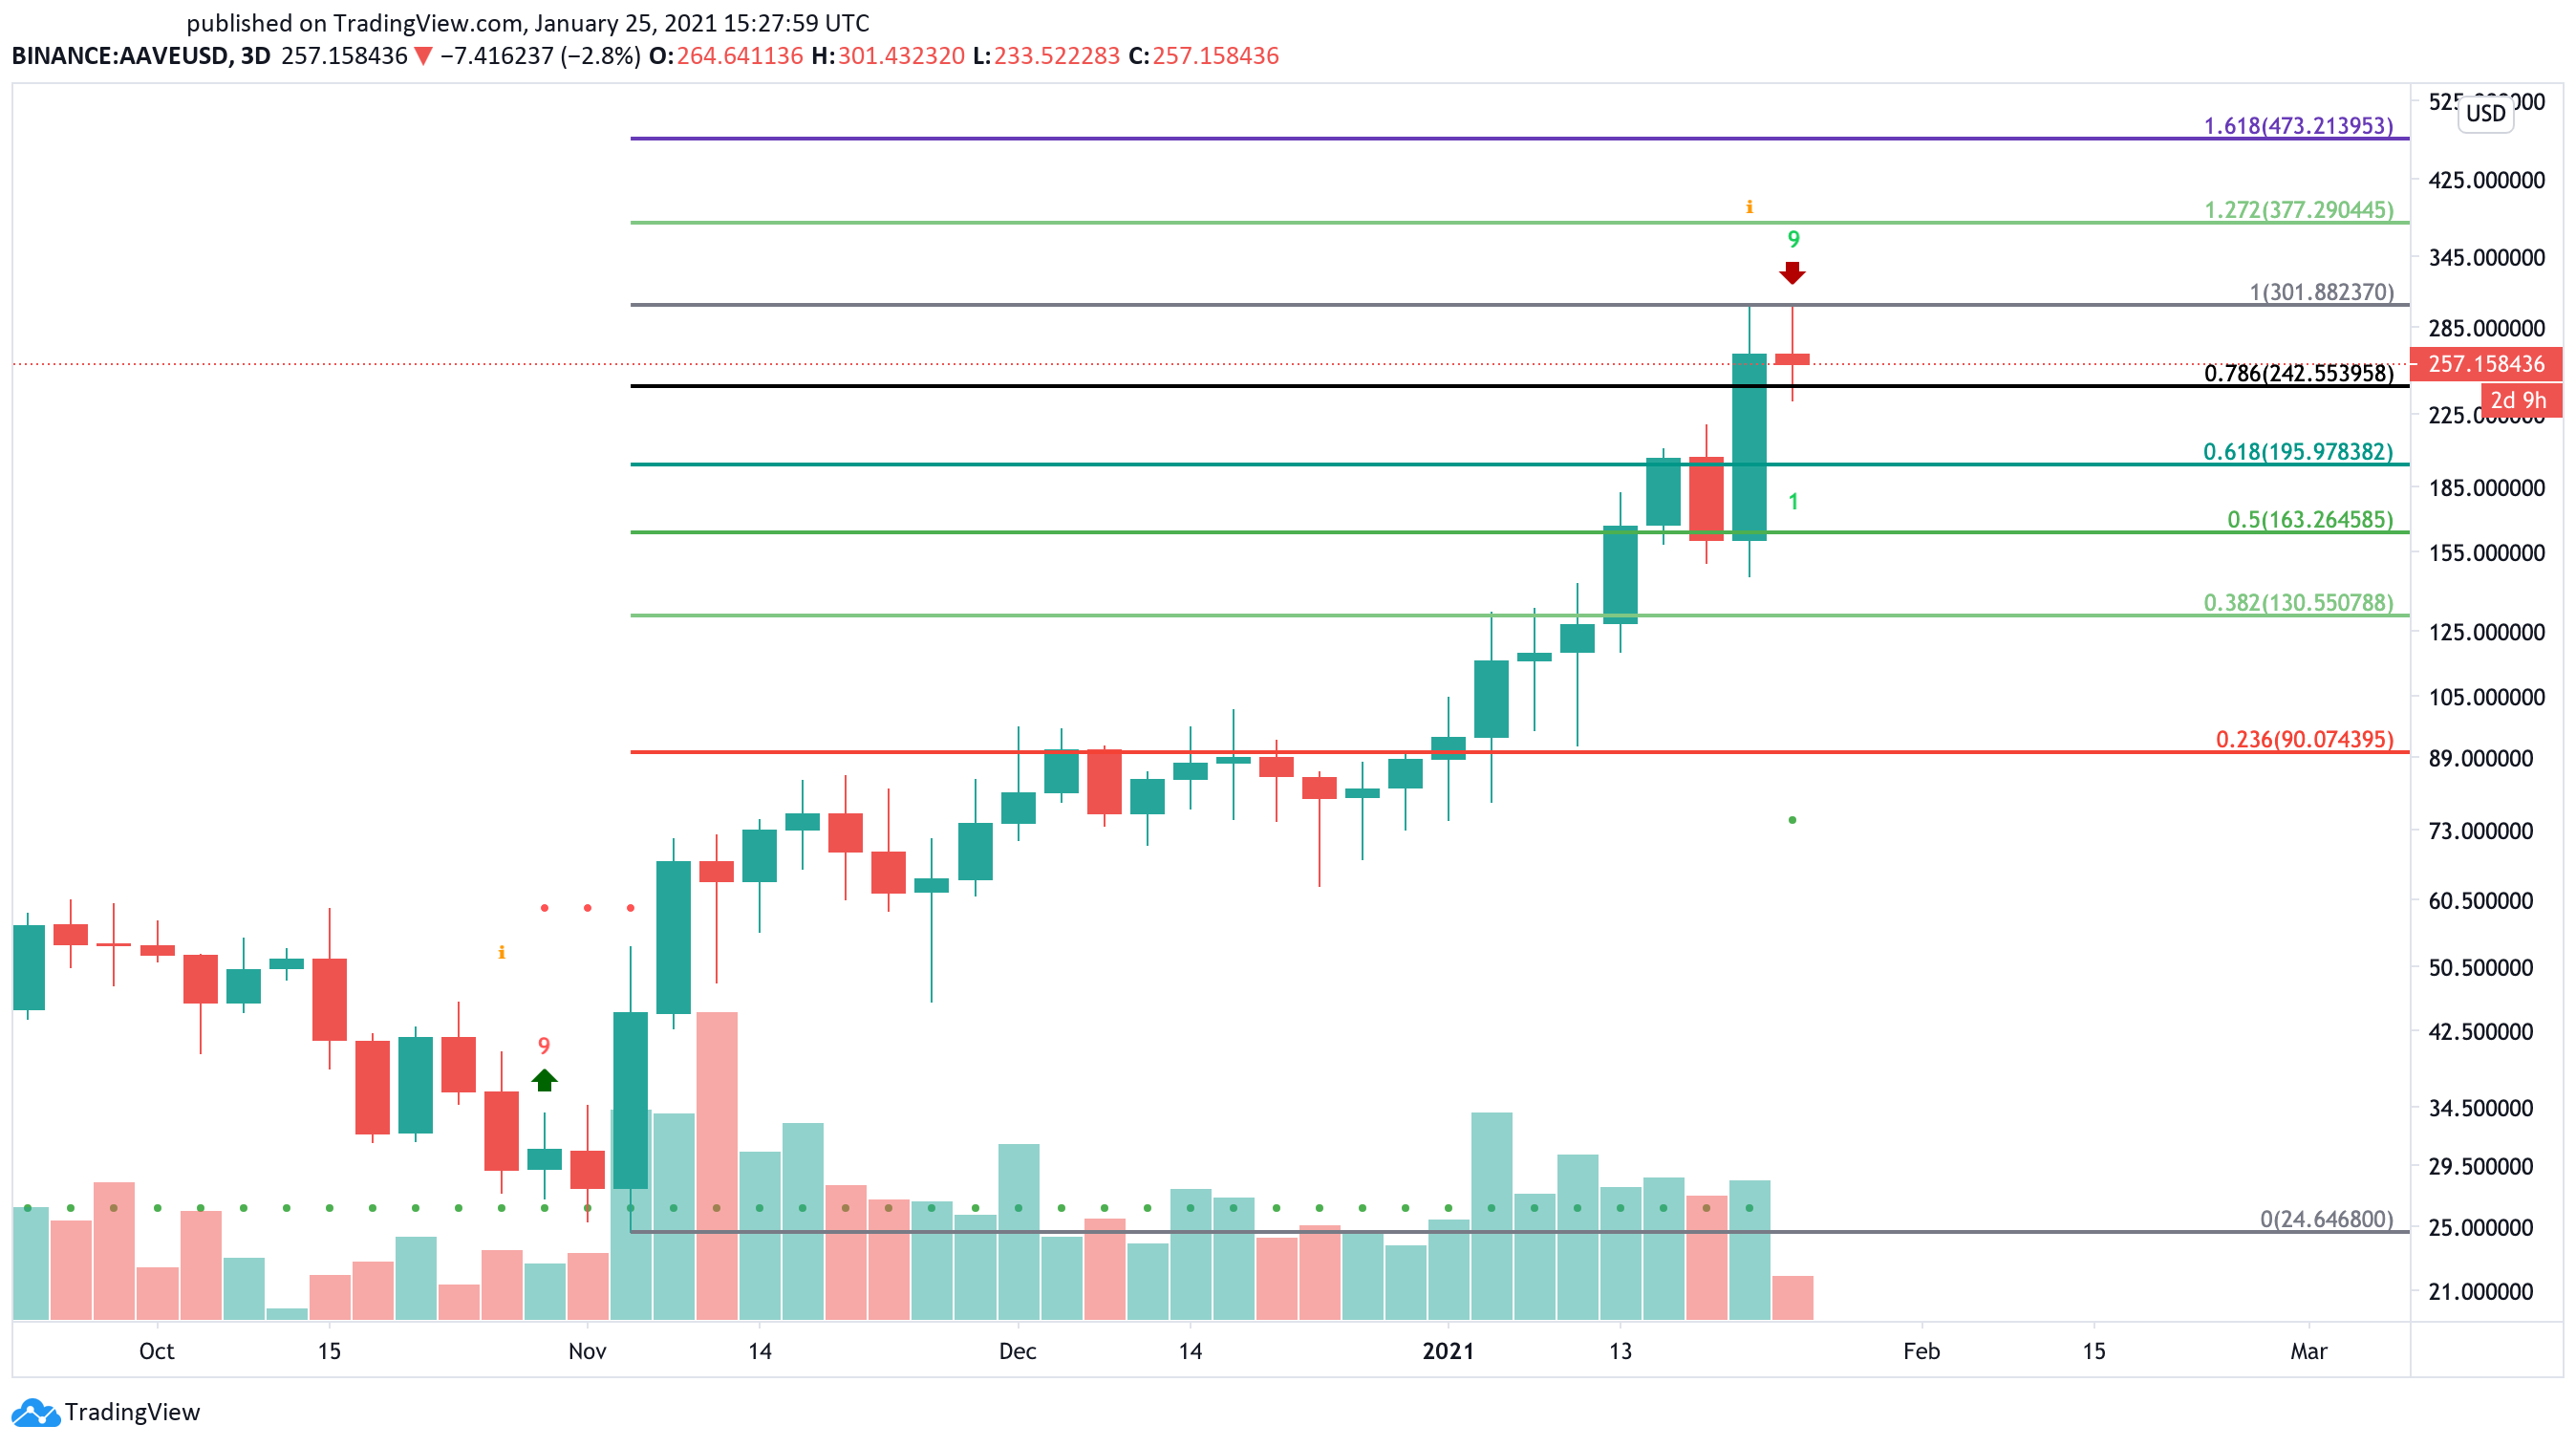
Nonetheless, a spike in buy orders around the current price levels could be strong enough to push Aave above its recent high of $300. Under such circumstances, the pessimistic thesis will be jeopardized, and this cryptocurrency will rise towards $500 or higher.
Yearn Attempts to Steal the Spotlight
While Uniswap and Aave have posted massive gains over the past few days, Yearn Finance has remained dormant, waiting for a spike in demand. This altcoin has only risen by roughly 29% since Jan. 22, while the other two coins took off.
But if YFI were to experience a similar price action as UNI and AAVE, its market value would surge towards $50,000.
As speculation mounts around Yearn Finance’s upside potential, large investors seem to be adding more tokens to their portfolios.
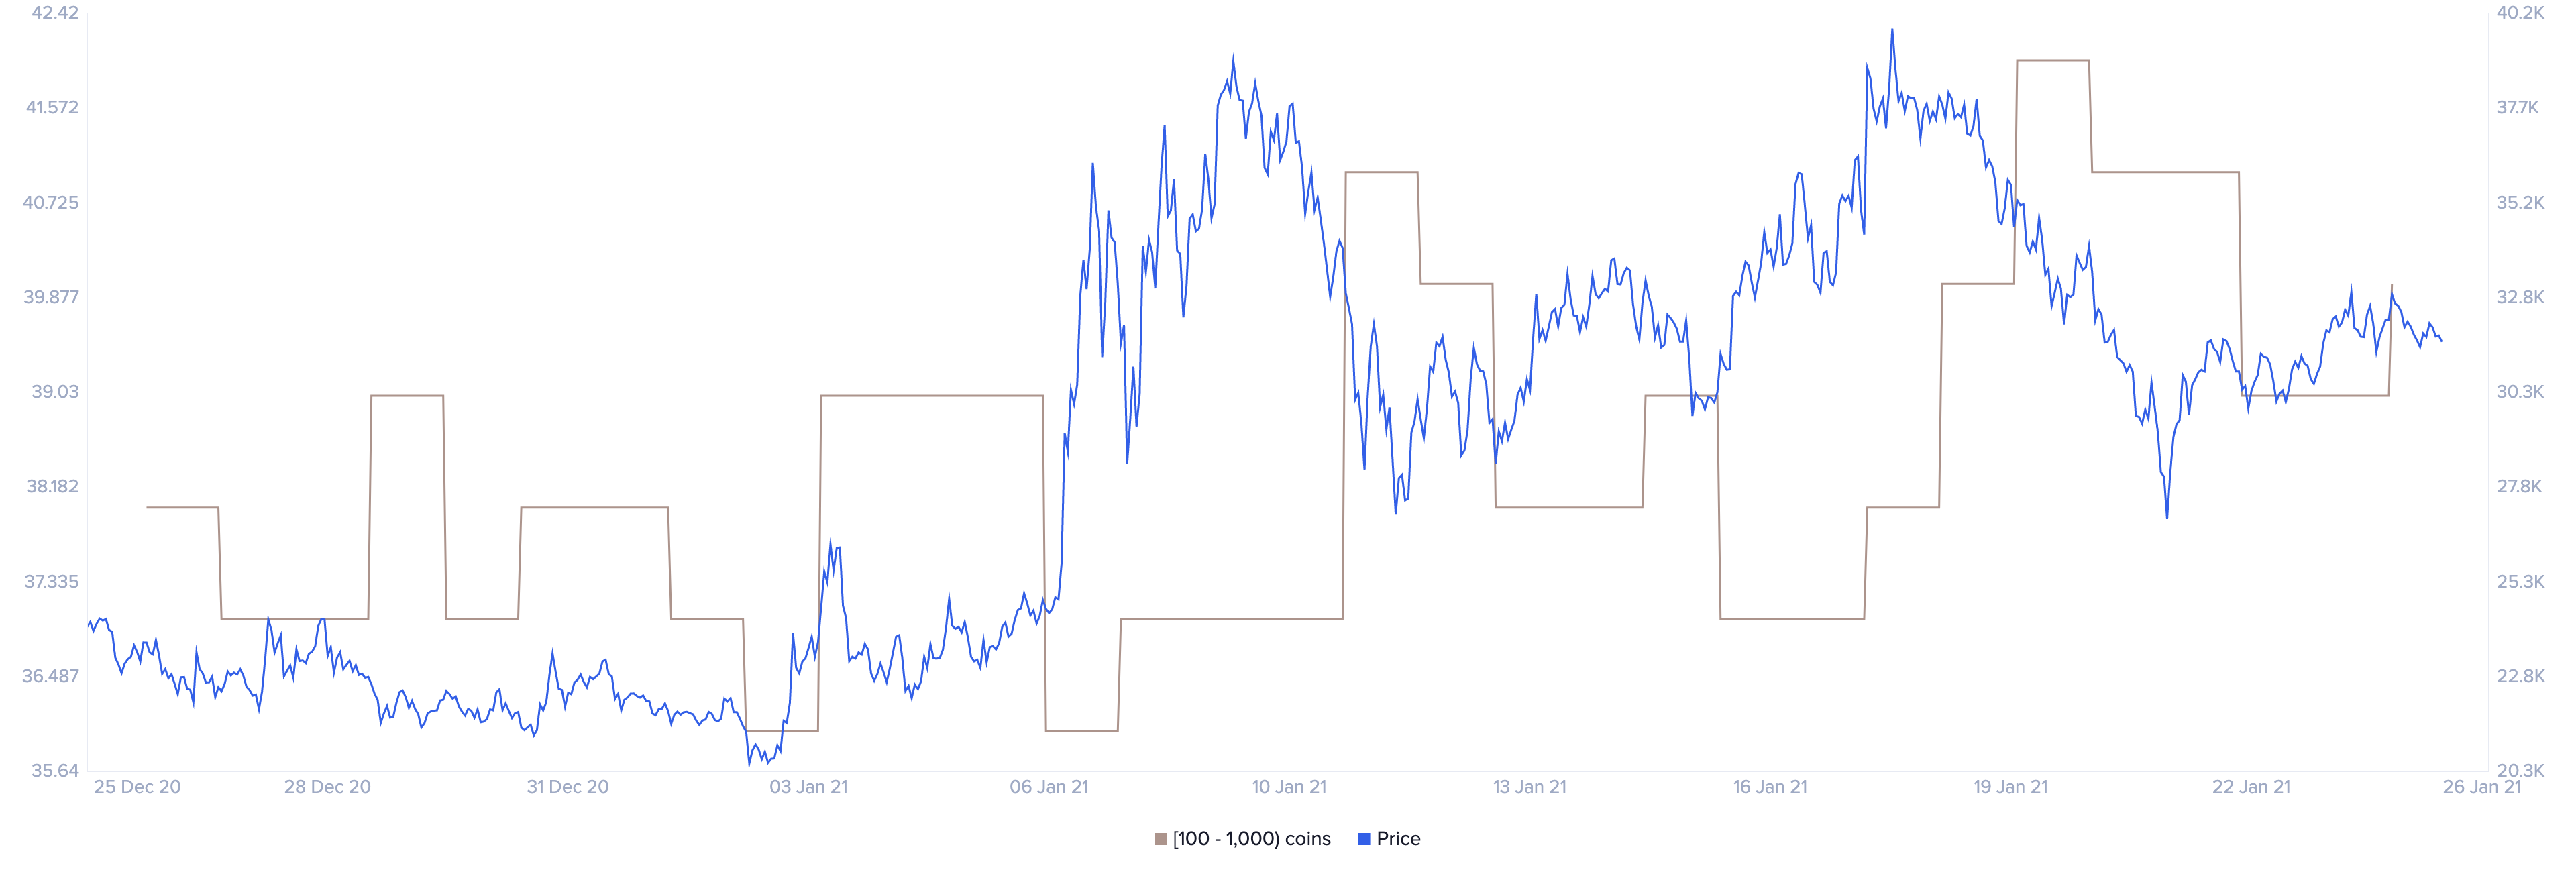
Santiment’s holder distribution chart shows that since the beginning of the month, the buying pressure behind this cryptocurrency has been increasing steadily. The behavioral analytics firm recorded a significant spike in the number of YFI whales on the network.
Indeed, the number of addresses holding 100 to 1,000 YFI shot up by 8.30% since then. Roughly three new whales have joined the network in such a short period.
The recent increase in large investors behind Yearn Finance may seem insignificant at first glance. But when considering that these whales hold between $3.2 million and $32 million in YFI, the sudden spike in buying pressure can translate into millions of dollars.
Still, Yearn Finance faces a massive resistance barrier ahead that it must overcome to advance further. Based on IntoTheBlock’s In/Out of the Money Around Price (IOMAP) model, more than 820 addresses had previously purchased nearly 4,000 YFI around $33,000.
Only a daily candlestick close above this supply wall will add credence to the optimistic outlook.
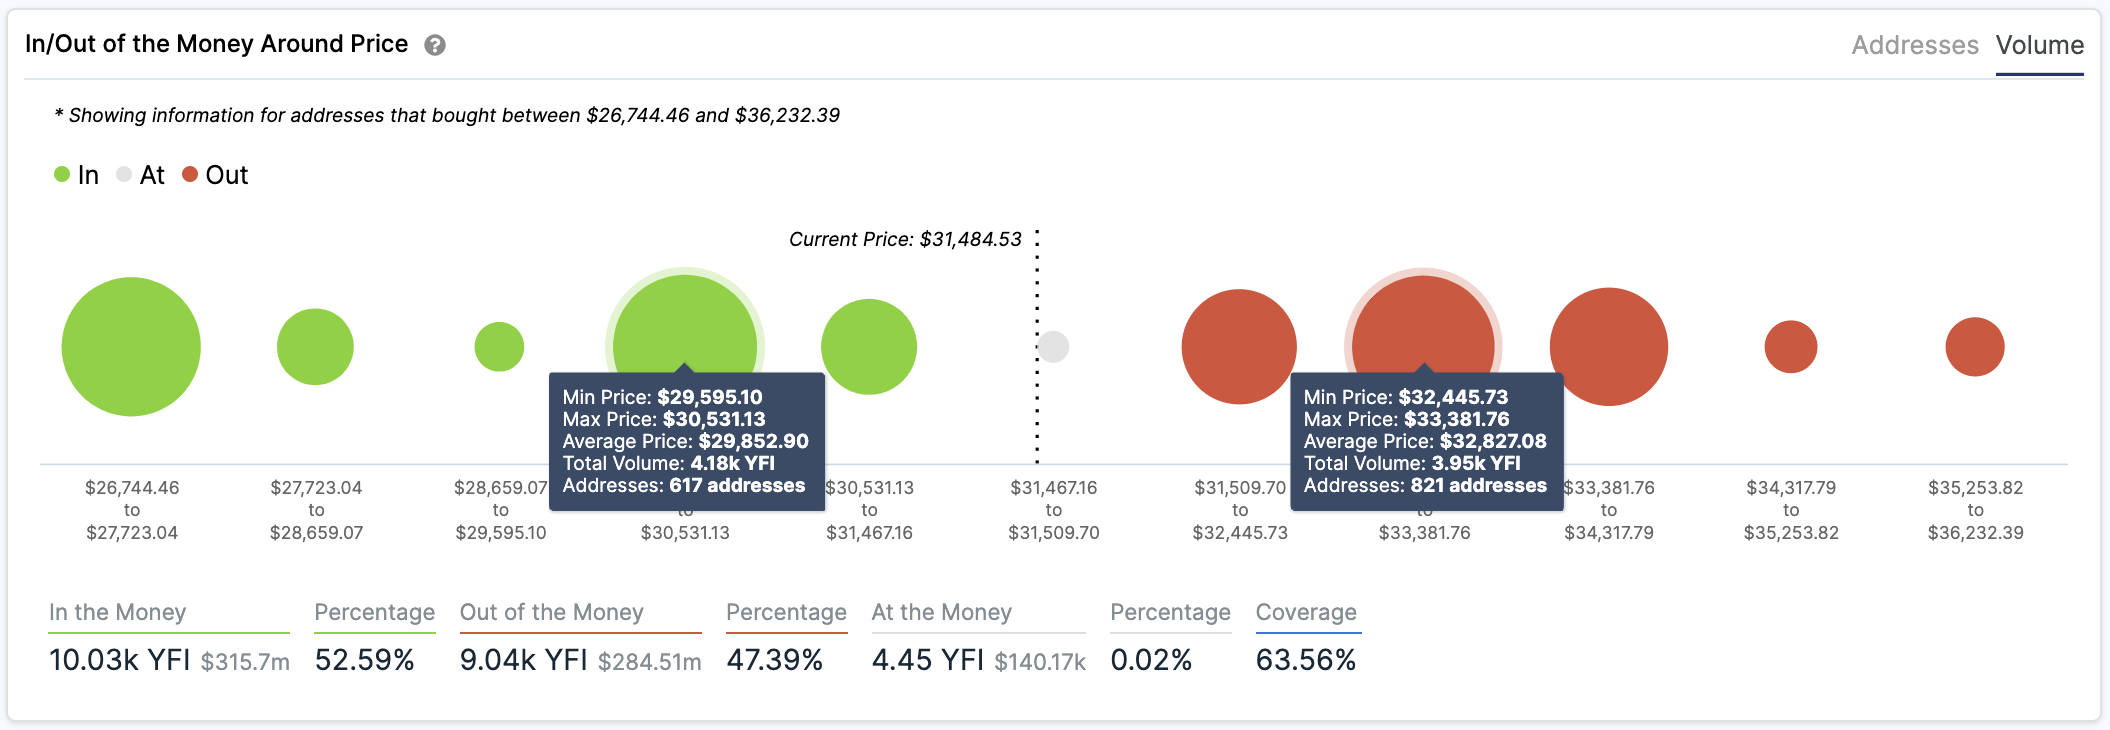
On the flip side, the IOMAP cohorts show that Yearn Finance sits on top of stable support. Over 600 addresses are holding roughly 4,200 YFI at $30,000.
This significant area of demand may have the strength to cap the altcoin’s downside potential as holders will likely do anything to avoid seeing their investments go into the red.
The DeFi Market Moves Forward
While Bitcoin appears to have entered a new corrective period, the DeFi market is booming.
Altcoins like Uniswap and Aave have taken the lead in the recent run-up as more capital flows into them. On-chain data from DeFi Pulse reveals that the total value locked (TVL) in UNI is approaching $4 billion while AAVE recently surpassed the $3 billion mark.
On the other hand, Yearn Finance has experienced a 30% growth in TVL year-to-date, which could soon manifest in its market value.
Time will tell whether the support levels of each cryptocurrency will hold, and whether prices will advance further.
Disclosure: At the time of writing, this author held Bitcoin and Ethereum.