
Shutterstock cover by REDPIXEL.PL
Key Indicator Suggests Major Bitcoin Correction in the Works
Following a nearly 1,000% bull run, on-chain metrics suggest that Bitcoin is bound for a significant correction.
After doubling in less than a month, Bitcoin bulls have dominated the narrative. Though further gains are likely, a particular on-chain metric suggests that the top is near.
1,000% Rally Without Any Major Corrections
Bitcoin has enjoyed an impressive rally ever since the market crash in mid-March 2020.
Following a 54% correction, known as Black Thursday, the pioneer cryptocurrency entered a new uptrend fueled by the havoc that COVID caused on the global economy. Indeed, institutional investors have flocked to the market en mass looking for a hedge against inflation.
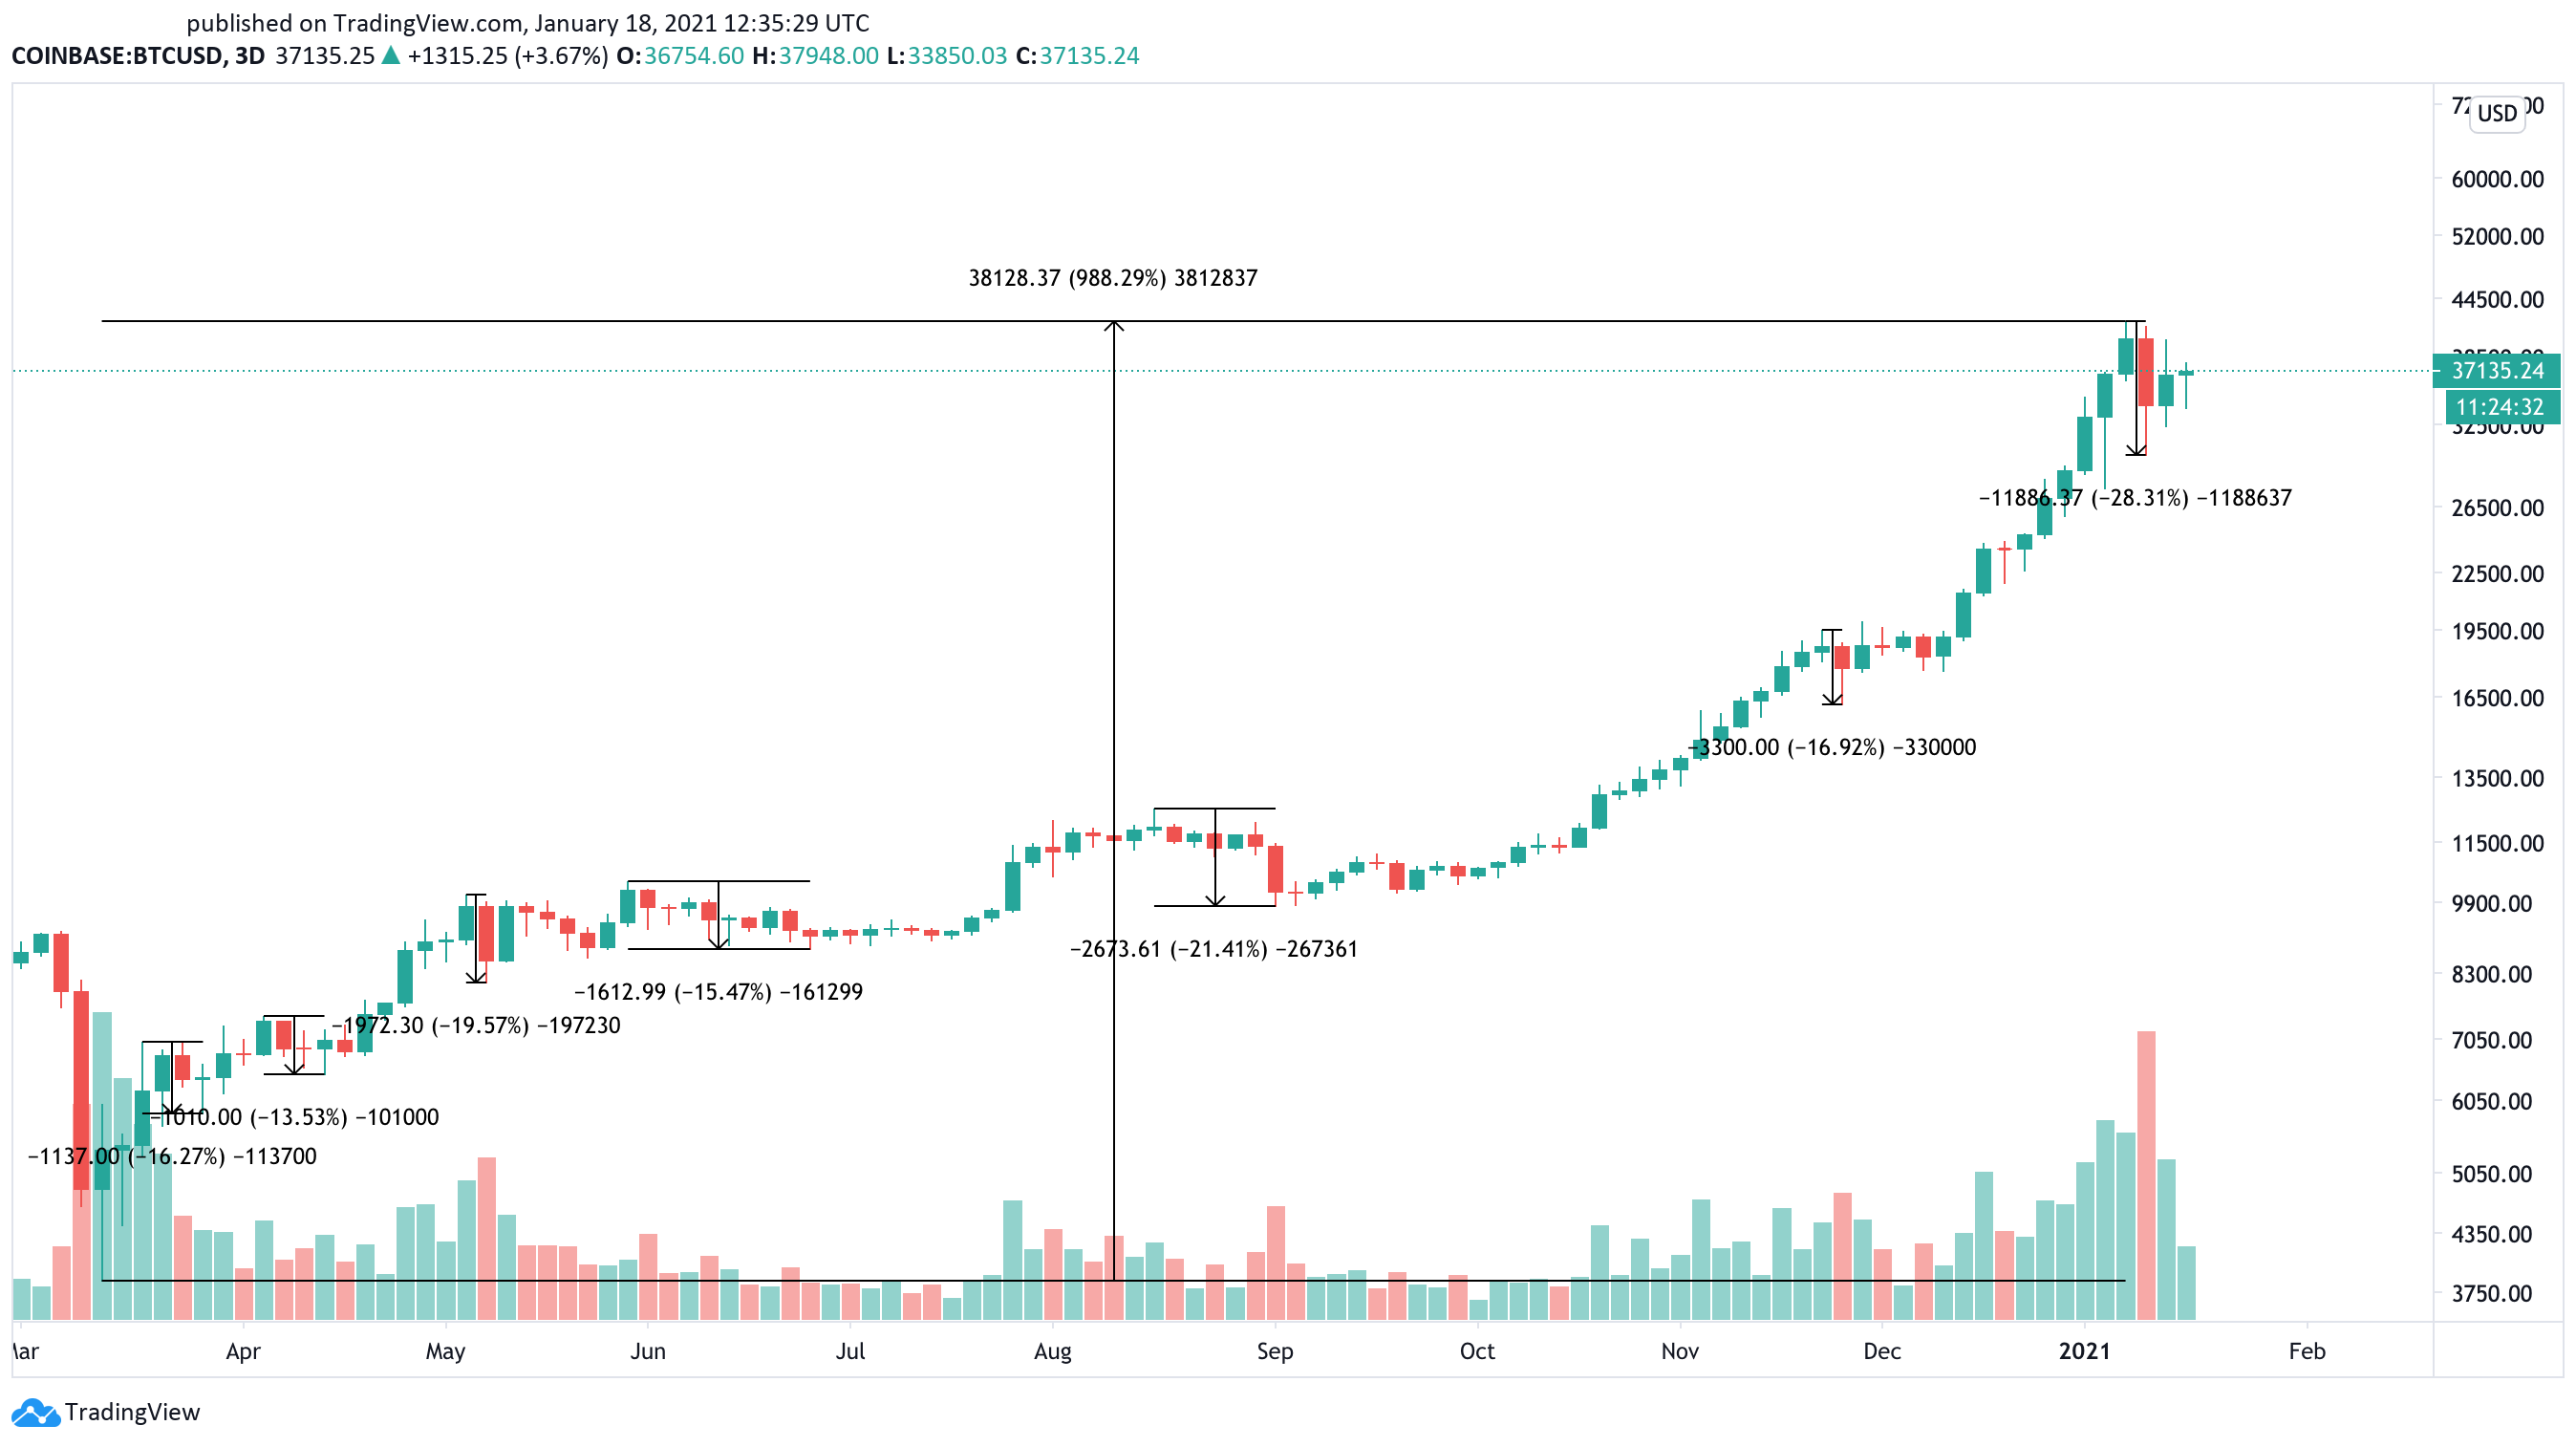
The significant increase in Bitcoin demand pushed its market value by nearly 1,000% since Mar. 13, 2020. BTC’s price went from trading at a low of $3,620 to make a new all-time high of $42,125.
The upswing was not entirely smooth since the flagship cryptocurrency suffered seven minor corrections that helped sidelined investors re-enter the market. As buying pressure increased in every pullback, BTC rose to make higher highs.
Most recently, Bitcoin experienced one of the largest one-day corrections since March 2020’s Black Thursday, shortly after surging to a record high of $42,125.
Its price plummeted by more than 26%, to hit a low of $30,450.
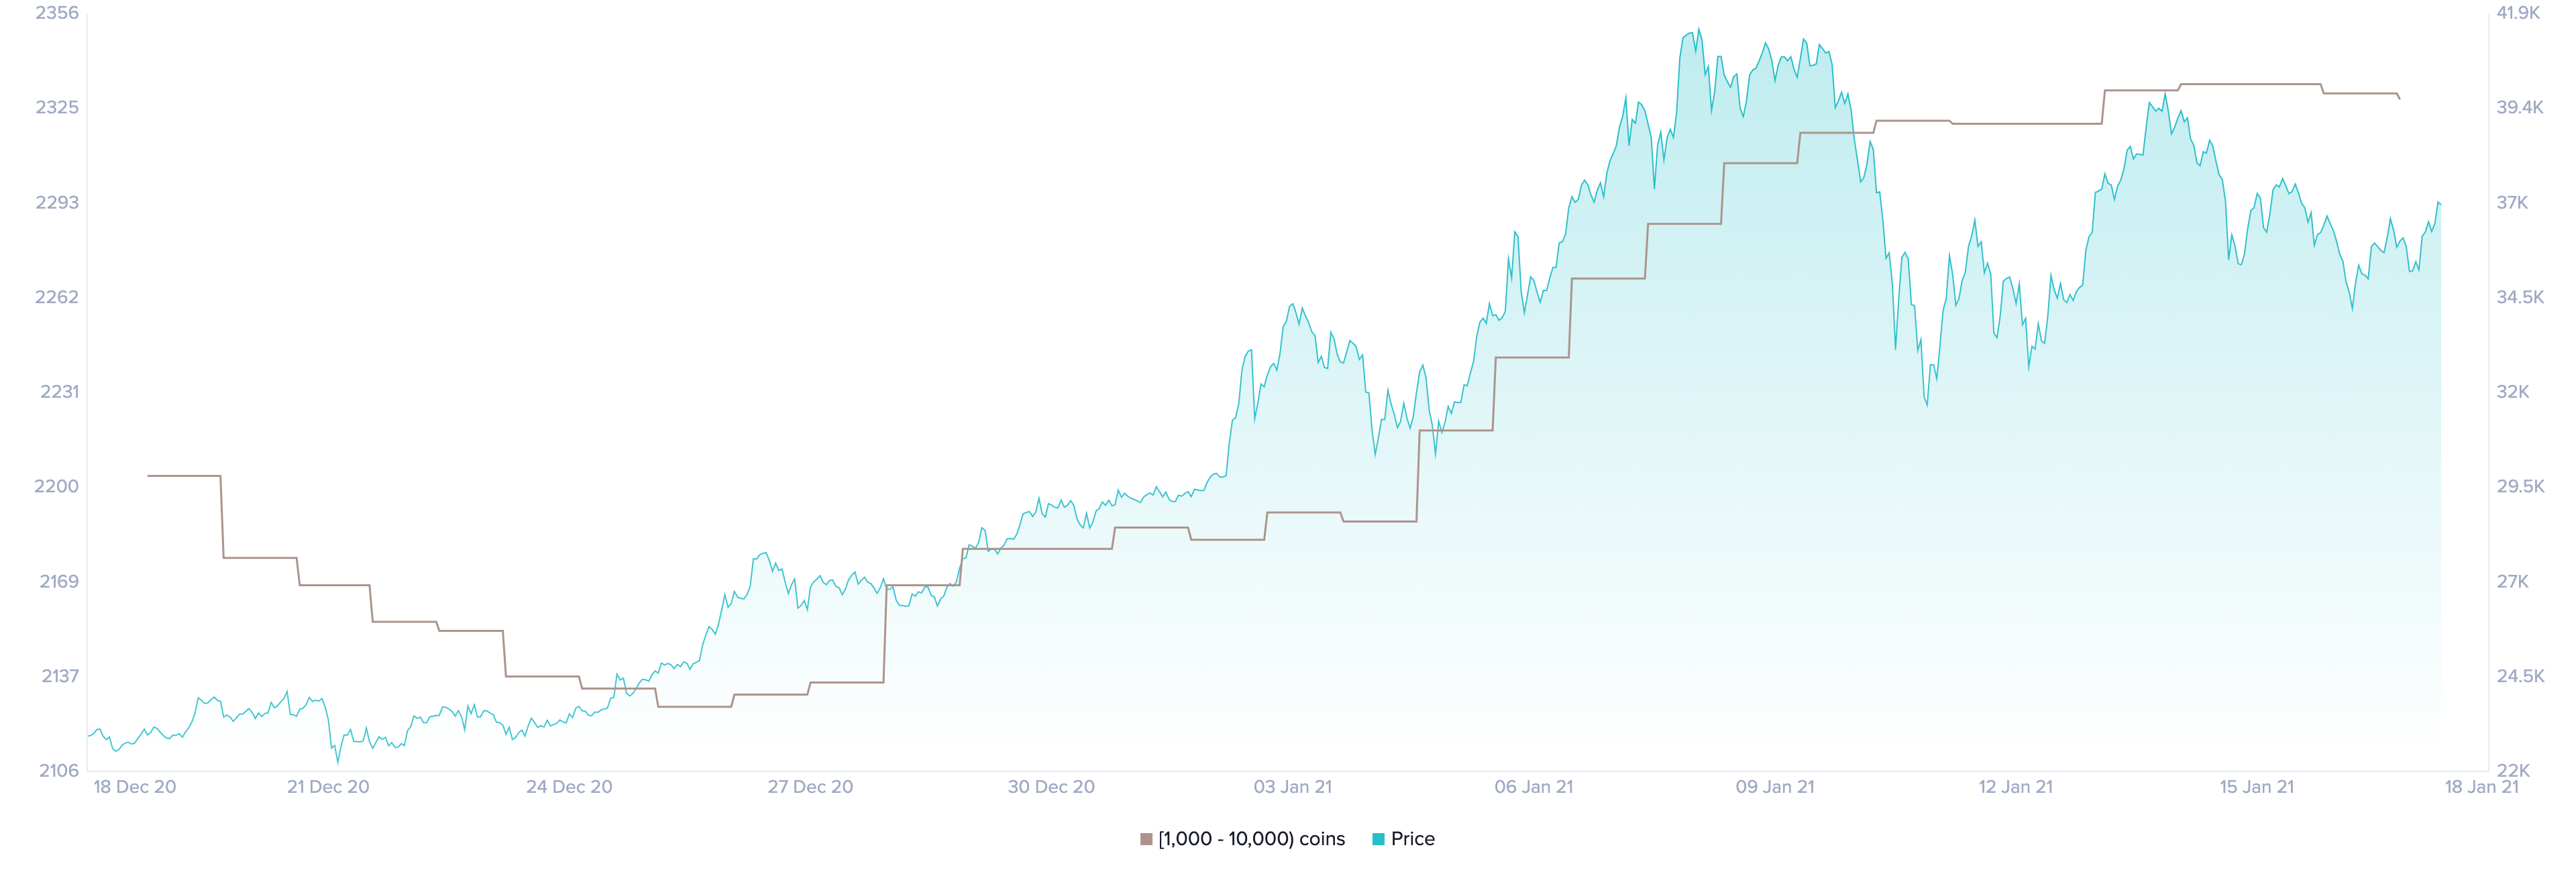
Some whales appear to have taken advantage of the downswing to add more tokens at a discount to their portfolios, as they have done in the past. The number of addresses holding 1,000 to 10,000 BTC surged by nearly 2% as prices tumbled.
Roughly 43 new mid-sized whales joined the network within a short period, helping Bitcoin regain the $35,000 level as support.
Although investors are preparing for another leg up that could see BTC rise above $50,000, one on-chain metric suggests that a market top is near.
Bitcoin Is Primed to Retrace
Based on the Spent Output Profit Ratio (SOPR) indicator, Bitcoin sits in overbought territory.
This fundamental metric represents the profit ratio of BTC tokens moved on-chain, measured through the variation between the purchase price and sale price.
“A SOPR value of greater than 1 implies that people are, on average, selling at a profit (because the price sold is greater than the price paid). Likewise, when SOPR is below 1, this implies that people would be selling at a loss,” according to Glassnode.
Each time this on-chain index rose to near a value equal to or higher than 1.20 over the past eight years, it served as a sell signal leading to a steep correction.
For instance, the SOPR rose to 1.19 in early April 2013 when Bitcoin was peaking at a high of $268.70. Following this milestone, BTC suffered an 81% retracement to hit a low of $51.30 over a week later.
Similar price action occurred after the SOPR rose to a high of 1.24 in late November 2013. Bitcoin saw its market value crash by 86%, dropping from a high of $1,177 to a low of $164.
The SOPR was also able to estimate that Bitcoin was bound for a pullback in mid-December 2017 when its price surged to an all-time high of nearly $20,000. During this time, the on-chain metric peaked at a value of 1.20, followed by the bear market of 2018.
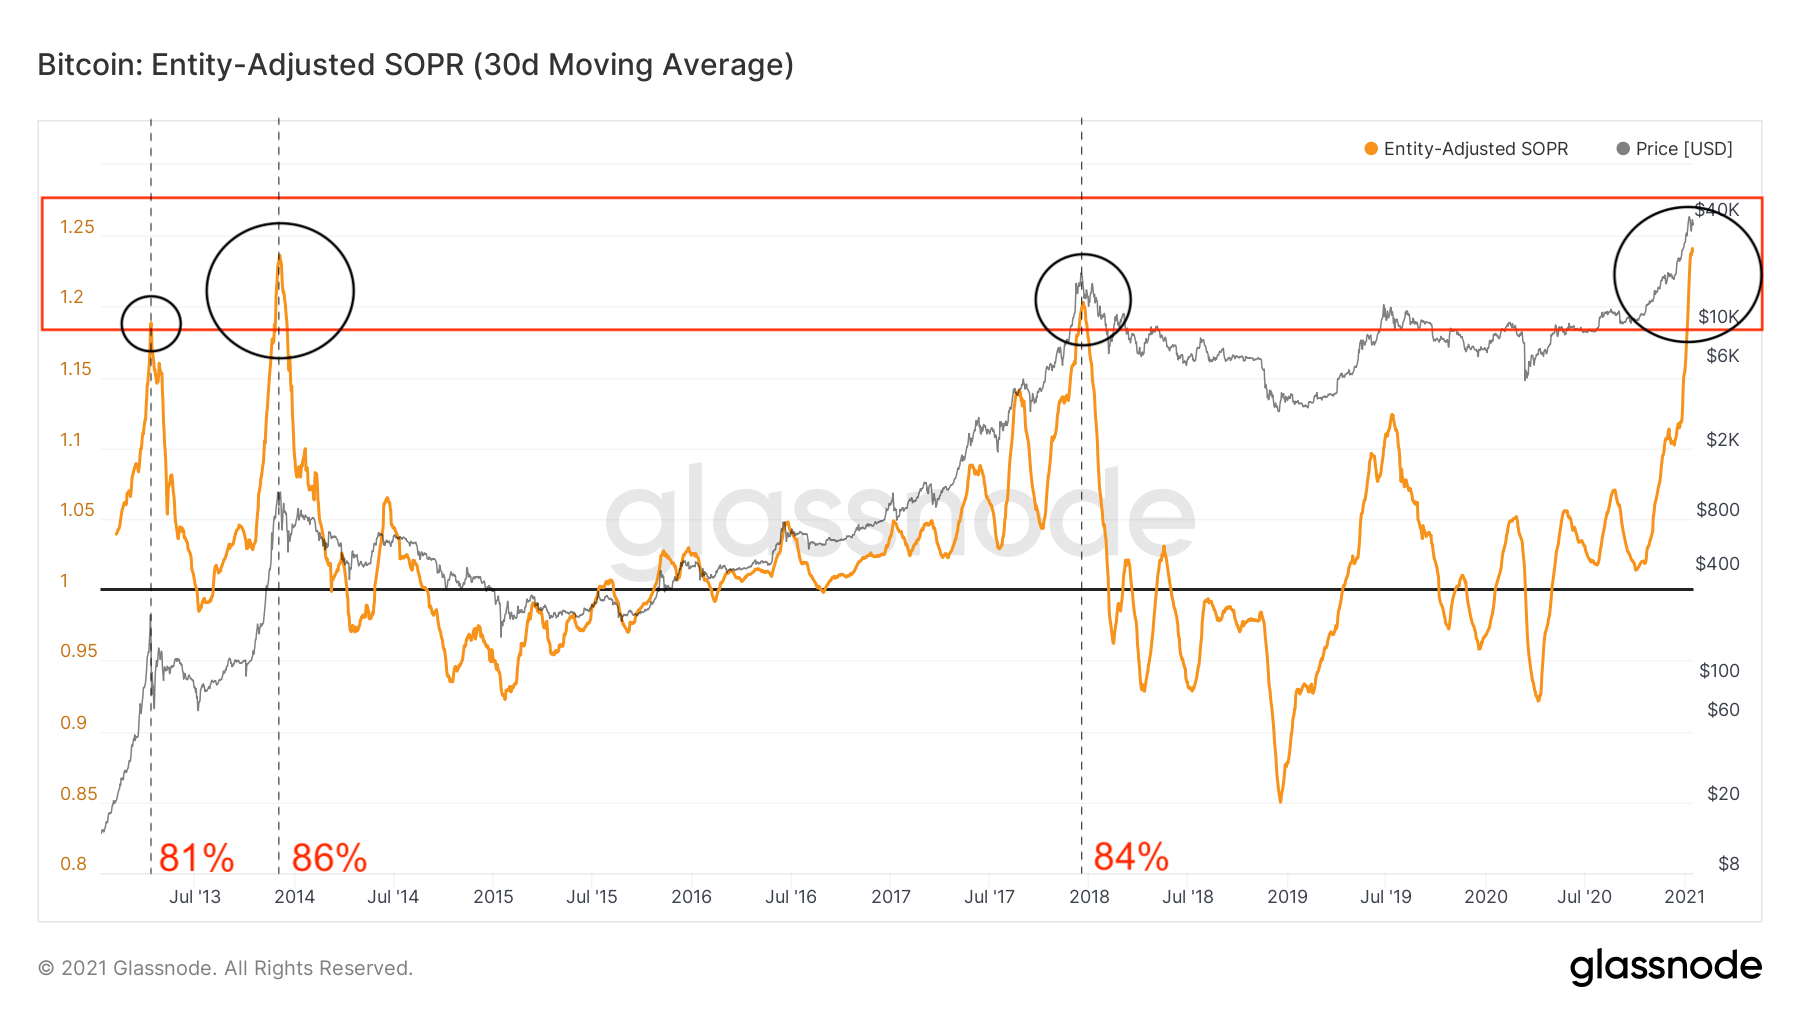
Now that Bitcoin has risen to a new all-time high of $42,125, the SOPR is hovering at a value of 1.24.
If this indicator proves to be as accurate as previous instances, BTC will likely enter a considerable corrective period before its uptrend resumes.
Key Price Levels to Watch
An 80% correction from the recent peak seems to be out of the question when considering the interest that high net worth individuals have shown for Bitcoin.
Regardless, such a steep decline is not uncommon in this token’s history, as explained previously.
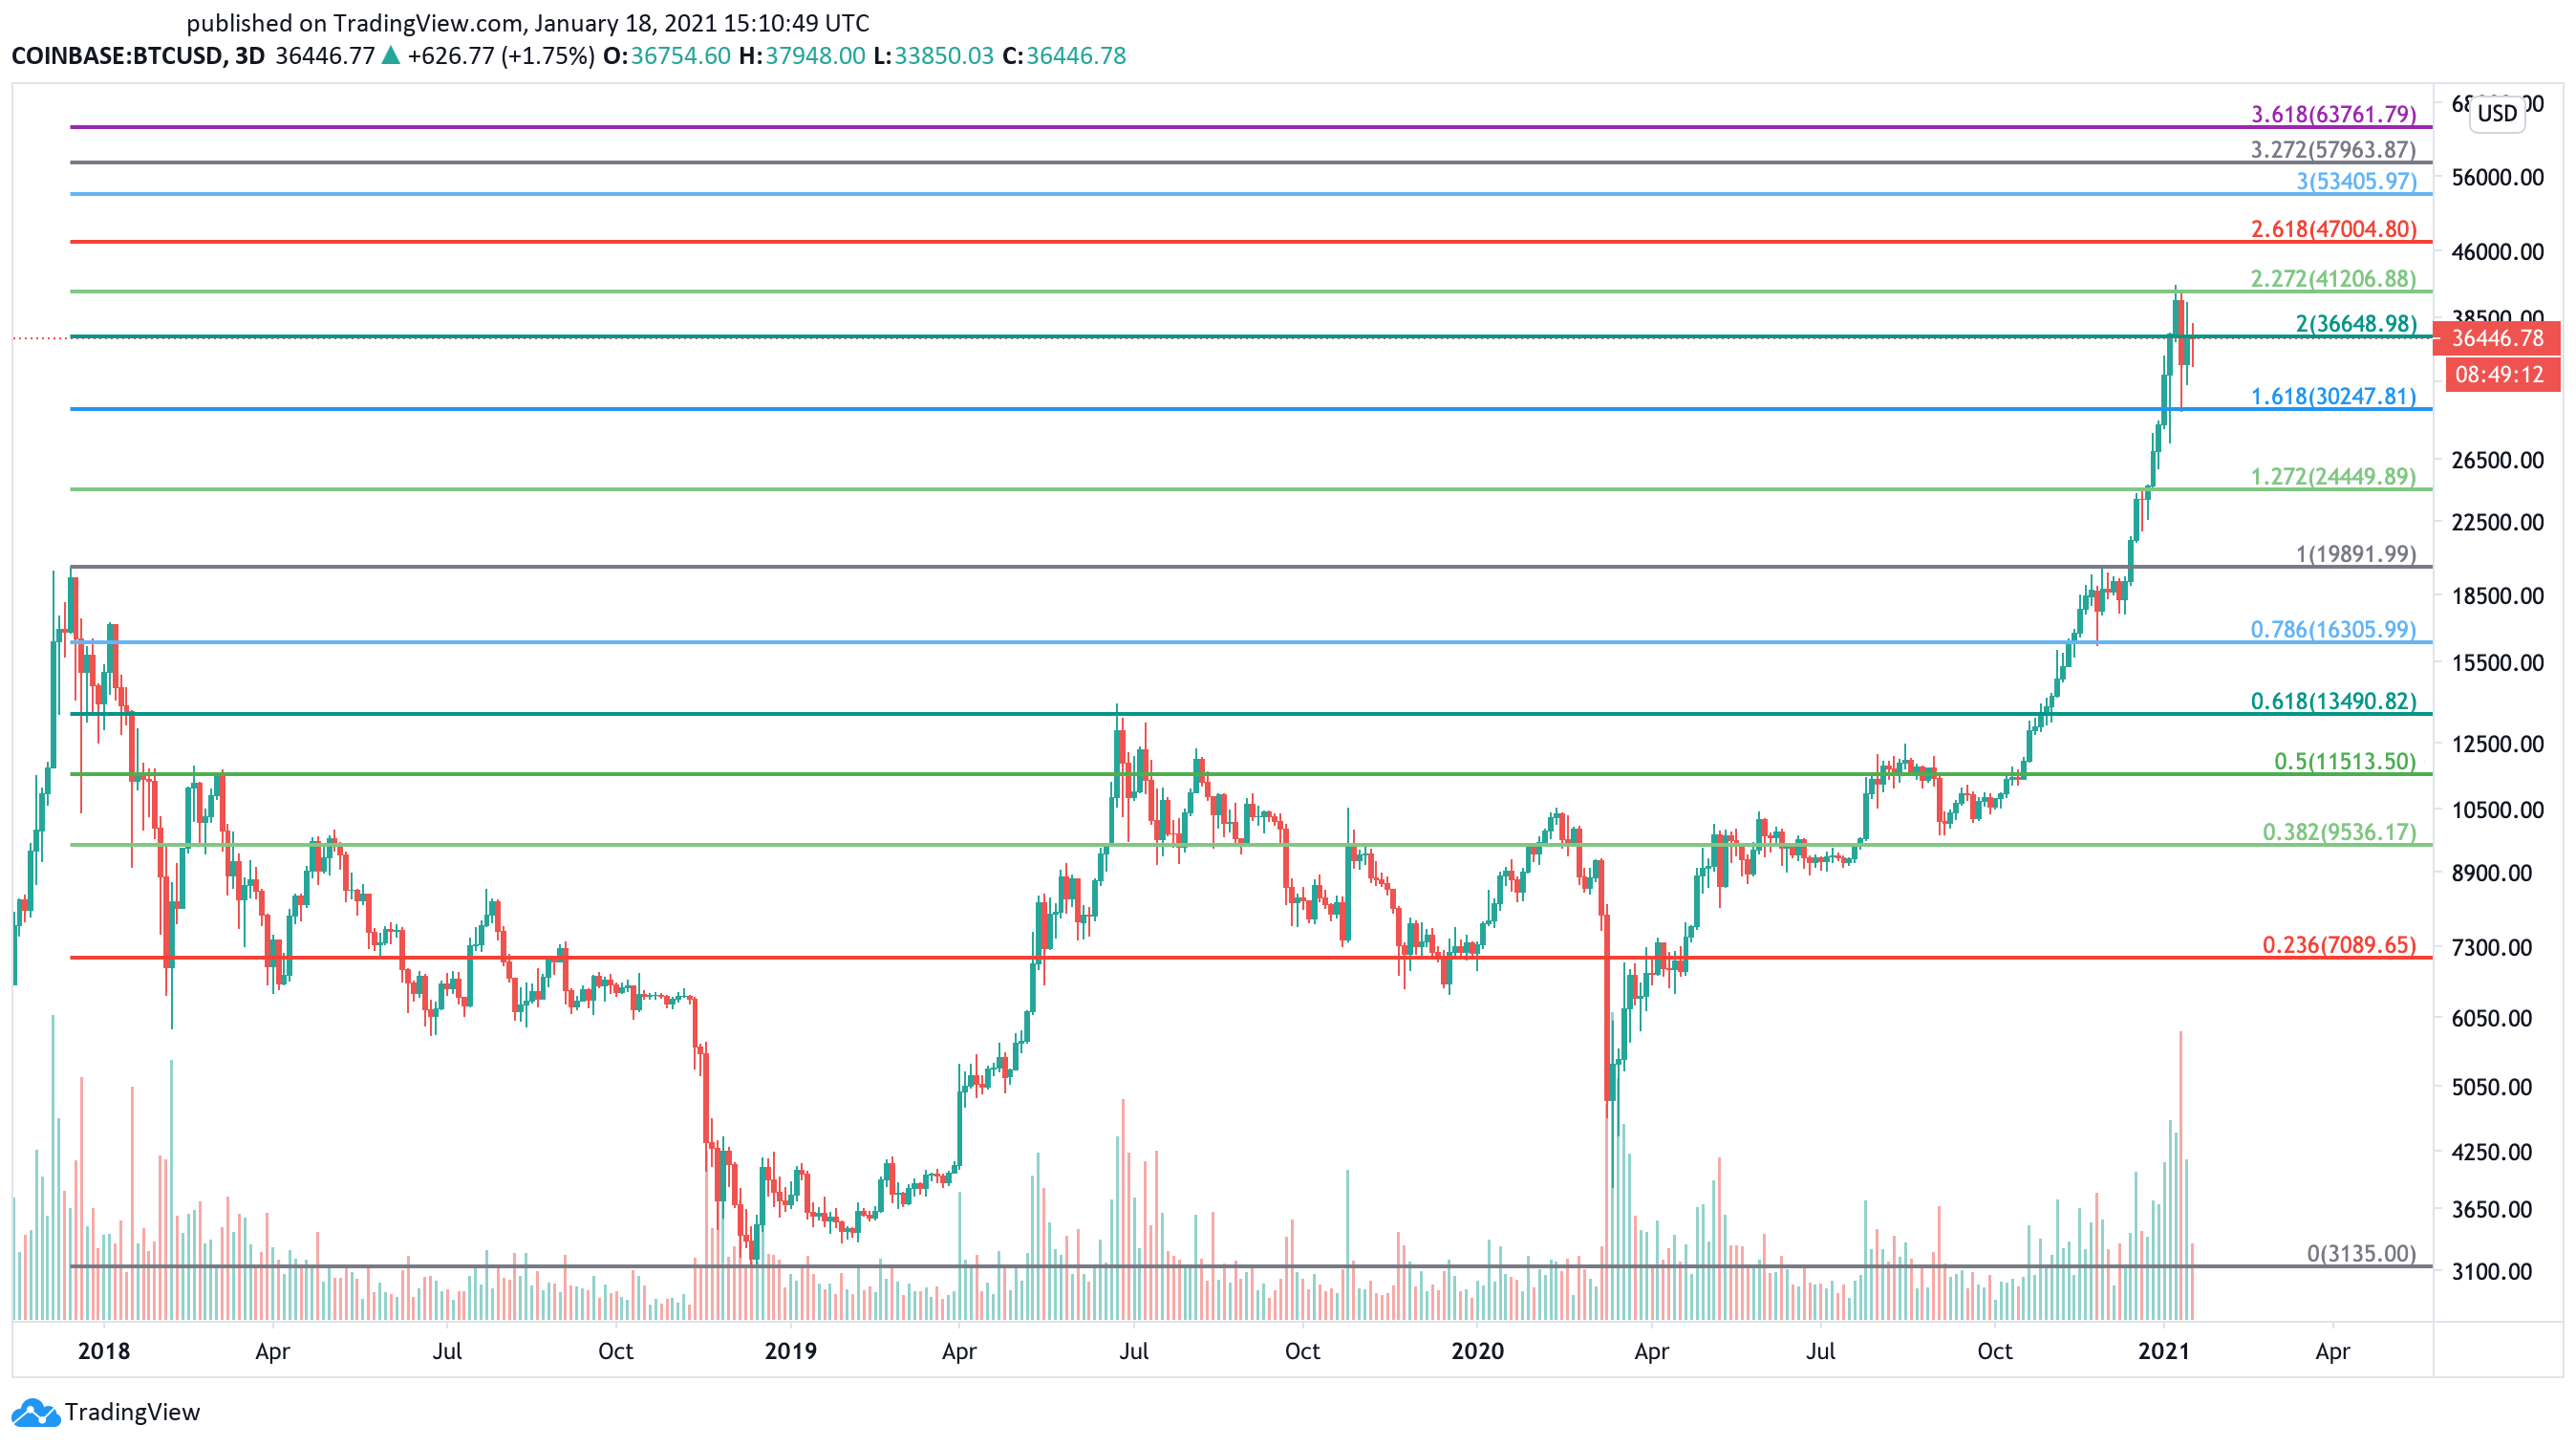
A sell-off of the magnitudes seen before will push BTC’s price towards $8,400. But to get there, the bellwether cryptocurrency will have to break through a significant number of demand barriers that sit underneath it.
Several support walls can be defined by measuring the Fibonacci retracement indicator from mid-December 2017’s peak to mid-December 2019’s low. First, Bitcoin will have to smash the $30,000 mark to target $24,000. Only a 3-day candlestick close below this level will signal a continuation of the downtrend towards $20,000.
If the $20,000 hurdle fails to hold the potential sell-off, then $14,000, $11,500, and $9,500 will come into play.
It is worth noting that despite the accuracy that the SOPR has had in anticipating previous market tops, the ongoing bull run is fueled by several fundamental factors that may invalidate any bearish signal.
Thus, if buying pressure continues to mount, investors must watch out for a break of the recent high of $42,125.
A 3-day candlestick close above this resistance wall will jeopardize the bearish outlook and lead to further gains. On its way up, Bitcoin could target $47,000, or even $53,400, before its next meaningful correction.
Disclosure: At the time of writing, this author owned Bitcoin and Ethereum.