
Bitcoin Price Analysis BTC / USD: $13,000 Rat Poison
Everything is overheated, but if it stabilizes we could see even more gains.
- Bitcoin has a bullish short-term bias, with the cryptocurrency trading at its highest level since January 2018
- Technical indicators on the four-hour time frame show that the BTC / USD pair is extremely overbought
- The daily time frame shows that bulls have now triggered a huge inverted head and shoulders pattern
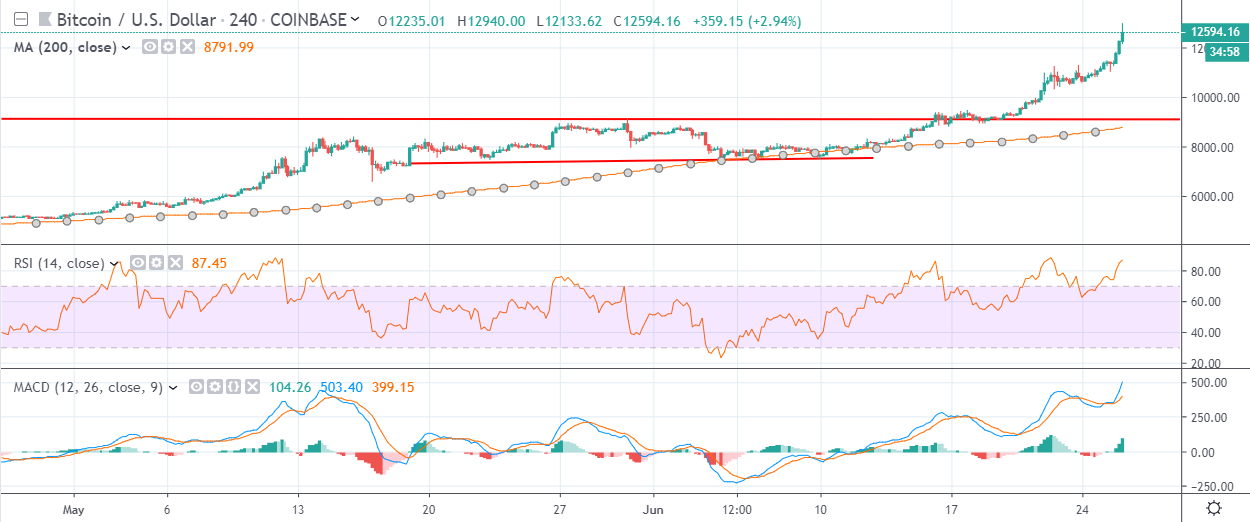
Bitcoin / USD Short-term price analysis
Bitcoin has a bullish short-term trading outlook, with the BTC / USD pair advancing to its highest trading level since June 2018 and spiking just shy of $13,000.
The four-hour time frame is showing that the BTC / USD pair has extended well beyond the bullish target of the invalidated head and shoulders pattern.
Key technical resistance on the mentioned time frame is currently located at the $13,000 and $13,500 levels.
Technical indicators on four-hour time frame are now trading in extreme overbought conditions.
Pattern Watch
Short-term traders should be mindful that a major bullish breakout has occurred on the daily time frame.
Relative Strength Index
The Relative Strength indicator on the four-hour time frame is also extremely overbought.
MACD Indicator
The MACD indicator on the four-hour time frame is still bullish, although it is extremely overbought.
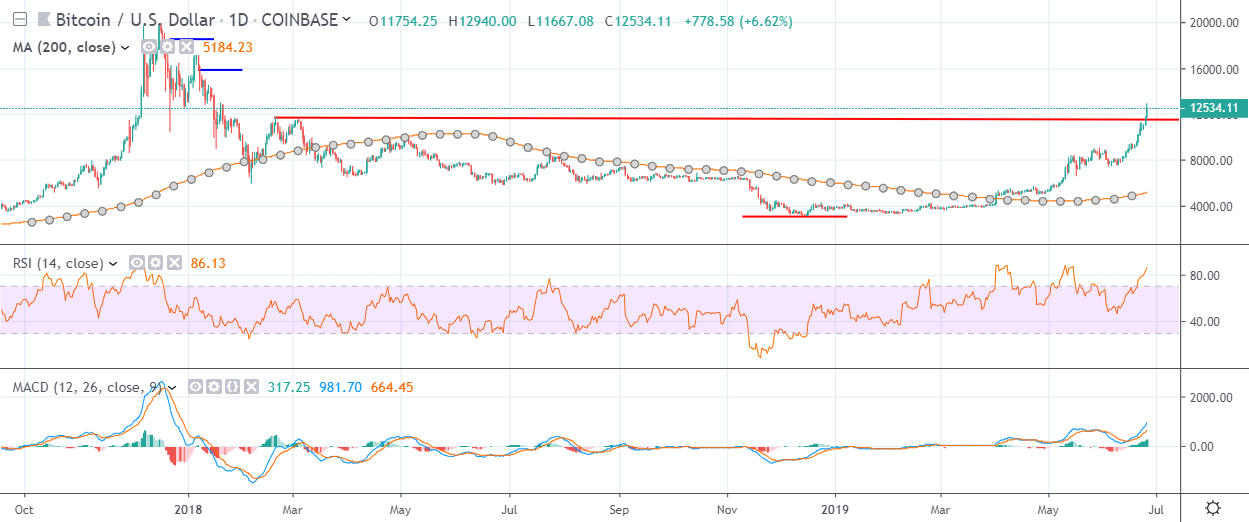
Bitcoin / USD Medium-term price analysis
Bitcoin has an increasingly bullish medium-term outlook, with the BTC / USD pair performing a major technical breakout on the daily time frame.
The daily time frame is showing that a large inverted head and shoulders pattern has been triggered, with the neckline of the bullish pattern located around the $11,800 level.
Key upcoming technical resistance on the daily time frame is currently found at the $16,000 and $18,500 levels.
Technical indicators on the daily time frame remain bullish and are still generating a strong buy signal.
Pattern Watch
Traders should monitor daily price closes above the $11,800 level for technical confirmation that the recent bullish breakout is in fact genuine.
Relative Strength Index
The Relative Strength indicator on the daily time frame is still bullish, although it is now extremely overbought.
MACD Indicator
The MACD indicator on the daily time frame is bullish and continues to issue a strong buy signal.
Conclusion
Bitcoin has performed yet another major technical breakout on the daily time frame, sending the number one cryptocurrency to levels not seen since January 2018.
The daily time frame shows that bulls may start to target towards the $16,000 and $18,500 levels if the BTC / USD pair can continue to hold price above the critically important $11,800 level.
If this continues, Warren Buffett’s lunch with Justin Sun is going to get messy.
Bitcoin was the first of our coin guides, and is also our highest-rated deep research project.