EOS Price Analysis EOS / USD: Whatevs
A technical reversal is occurring.
- EOS has a bullish short-term outlook, with the cryptocurrency recently posting a fresh 2019 trading high
- The four-hour time frame shows that the bullish inverted head and shoulders pattern has reached its full upside projection
- The daily time frame shows that price is now moving back towards neckline support
EOS / USD Short-term price analysis
EOS has a bullish short-term bias, with the cryptocurrency recently advancing to a fresh 2019 trading high.
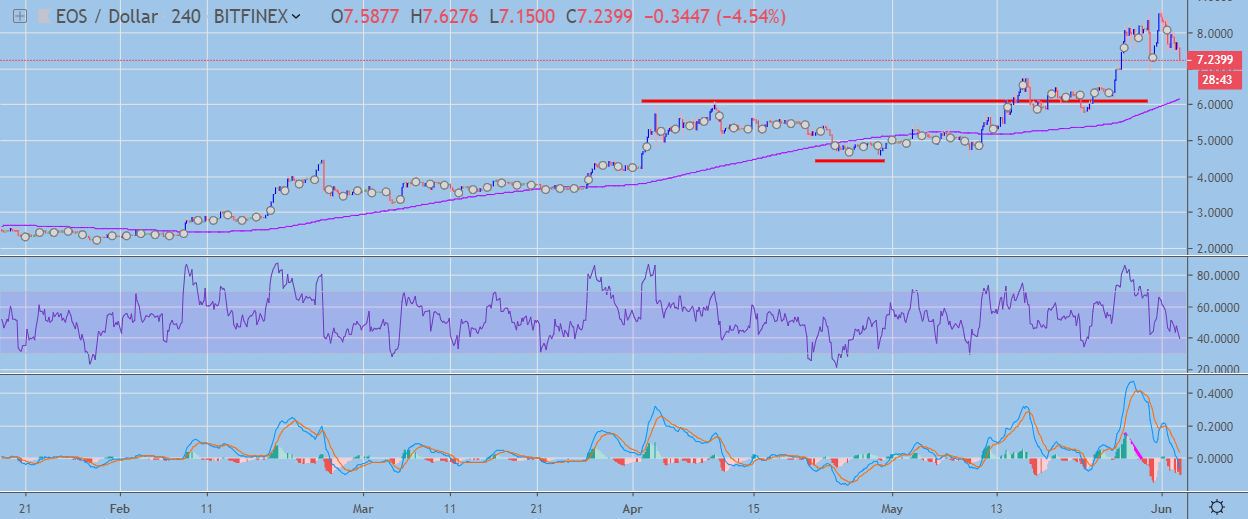
The four-hour time frame shows that the inverted head and shoulders pattern has reached its full upside projection, with the EOS / USD pair currently staging a strong technical reversal.
Technical indicators on the four-hour time frame have turned bearish and are now generating sell signals.
 EOS / USD H4 Chart by TradingView
Pattern Watch
Traders should note that a bearish head and shoulders pattern could start to form on the four-hour time frame if the downside correction gathers pace.
Relative Strength Index
The RSI indicator is also bearish on the four-hour time frame and is highlighting the growing short-term selling pressure.
MACD Indicator
The MACD indicator on the four-hour time frame has turned bearish and continues to generate a sell signal.
Fundamental Analysis
EOS investors have been selling the news, after Block.one announced that it is planning to launch a new social media applications called “Voice” that will run on the updated EOSIO2 software.
However, the public reaction to the news was rather negative. The new social network does not appear to offer a unique value proposition, and overall it appears the community expected something bigger than a new social dApp.
EOS / USD Medium-term price analysis
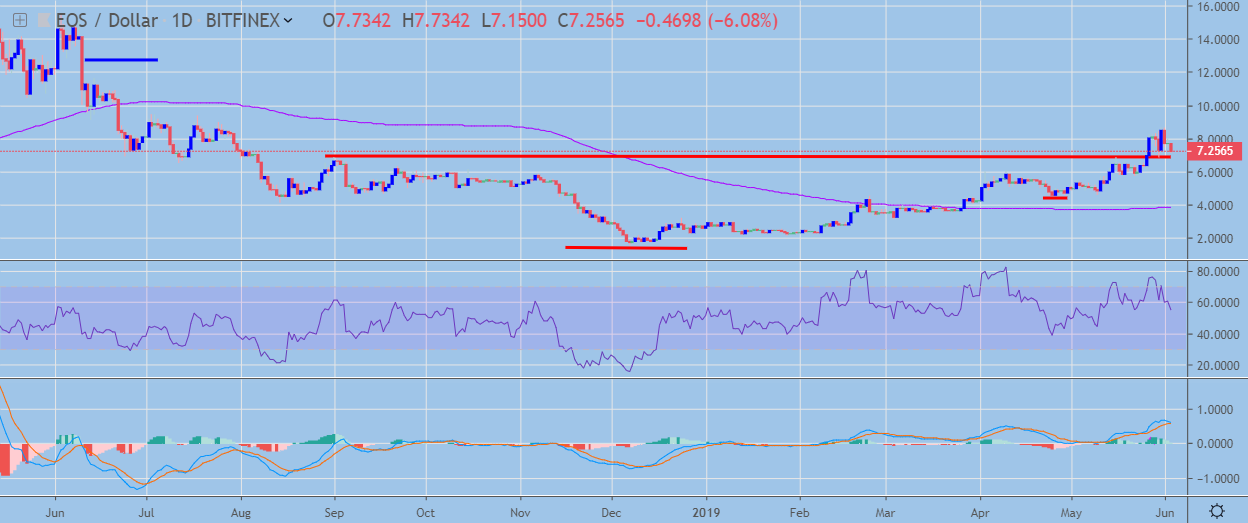
EOS has a bullish medium-term outlook, with the cryptocurrency still trading above major trendline support on the daily time frame.
The daily time frame is showing that the EOS / USD pair is starting to reverse lower, after a potential false breakout above the neckline of the large inverted head and shoulders pattern.
Technical indicators on the daily time are moving lower and are now at risk of turning bearish.
 EOS / USD Daily Chart by TradingView
Pattern Watch
Traders should note that the July 15th swing high still remains the bullish target of the inverted head and shoulders pattern on the daily time frame.
Relative Strength Index
The Relative Strength indicator is turning lower on the daily time frame, with the indicator now approaching neutral levels.
MACD Indicator
The MACD indicator on the daily time frame remains bullish, although downside pressures are building.
Conclusion
EOS is undergoing a strong technical reversal on both time horizons after earlier advancing to a fresh 2019 trading high.
The EOS / USD pair’s short and medium-term bullish bias still remains intact, with the daily time frame continuing to show the July 15th, 2018 swing-high as a likely bullish target.
For a quick check up of the basics of EOS, we published a coin guide.