Ethereum, XRP, and Litecoin Outperform Amidst Market-Wide Crash
The cryptocurrency market is going through a period of high volatility, but there are critical support levels preventing Ethereum, XRP, and Litecoin from a steeper decline.
Ethereum, XRP, and Litecoin continue to hold steady despite the recent market-wide crash. A new series of developments around these altcoins are making the headlines, which could set them up for major price movement.
Demand for Ethereum Explodes
Grayscale Ethereum Trust, a financial product that enables investors to gain exposure to the price movement of ETH, has been on a tear over the last two weeks. The FINRA-approved investment vehicle rose from a low of $96 to recently reach a new yearly high of $217.
Such a powerful bullish impulse represents a 127% price increase. This impulse may indicate that institutional demand for Ethereum is skyrocketing. But large investors are not the only ones trying to get a piece of the smart contracts giant.
Bitfinex, a retail-oriented cryptocurrency exchange, reported that the number of long Ether positions on its platform has been pilling up. Since the beginning of the year, they have risen by more than 580%. The Hong Kong-based trading firm recently recorded a new all-time high of nearly half a billion dollars worth of long ETH positions.
While demand for Ethereum goes through the roof, its price has been contained within an ascending parallel channel since mid-March. The recent rebound from the lower boundary of the channel sent Ether towards the middle line of this technical pattern. This resistance barrier is now key to Ether’s trend.
By breaking above it, the smart contracts giant would likely rise towards the top of the channel as it has done it in the past three months. But if this supply wall can reject the price of ETH, it is reasonable to expect a downswing to the bottom of this technical formation.
The Fibonacci retracement indicator adds credence to this ambiguous outlook. A spike in volume that allows Ethereum to turn the 78.6% Fib level into support could lead to a further advance to mid-February’s high of $287. Failing to do so, however, may see this altcoin drop towards the 61.8% Fib level.
It is worth noting that in the event of a correction, the 61.8% Fib level must hold for the uptrend to remain intact. Otherwise, Ethereum could plummet to the 38.2% Fib level that sits around $165.
XRP Could Add New Feature as Its Price Consolidates
Network validators seem ready to introduce a new feature to the XRP ledger (XRPL) dubbed “Checks.” The idea behind it is to implement a system similar to paper checks that allow network users to transfer funds intermittently.
“Checks work similarly to personal paper checks. The sender signs a transaction to create a Check for a specific maximum amount and destination. Later, the destination can cash the Check to receive up to the specified amount,” reads the amendment.
Although this attribute was first proposed in 2018, a UNL validator recently brought it back to life, and it is only one vote away from being approved.
This shows that Ripple has been staying true to its long-term roadmap, which is consistent with the spikes in development activity seen over the past few months, based on data from Santiment.
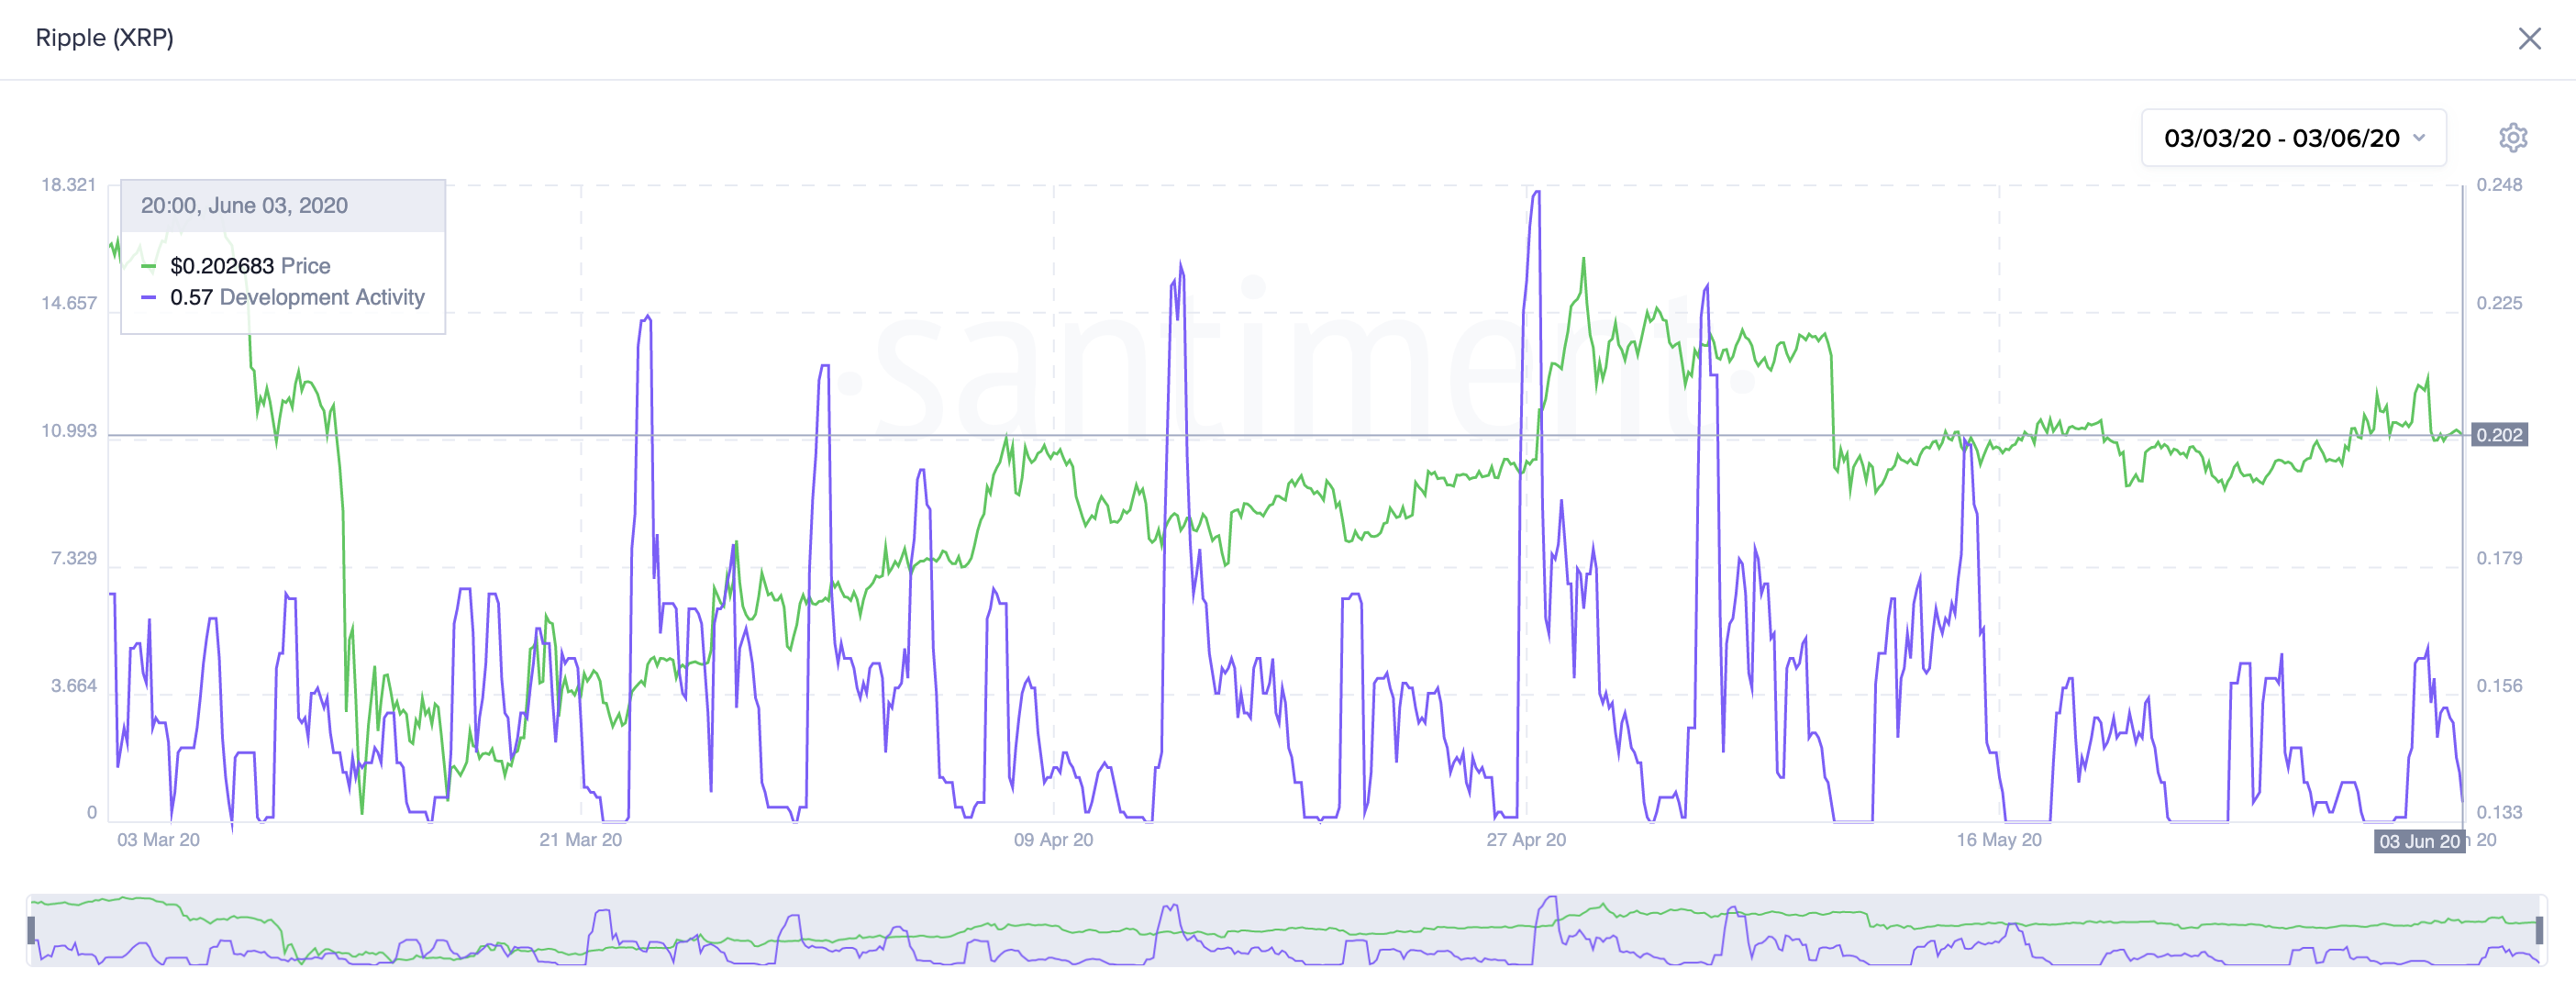
From a technical perspective, the cross-border remittances token is currently sitting in a no-trade zone. The area is defined by the 50 and 200-day moving averages. These support and resistance levels are hovering around $0.20 and $0.215, respectively.
Breaking above this no-trade zone may see XRP rise towards early May’s high of $0.236 or even higher. If this were to happen, the next significant resistance levels to watch out are the 127.2% and 141.4% Fib levels.
On the reverse, an increase in the selling pressure behind this cryptocurrency could push it below the 50-day moving average. Moving past this supply barrier may see it drop to the 61.8% or the 50% Fib levels.
Anonymous Litecoin Transactions Closer Than Ever
Litecoin’s Mimblewimble-based privacy efforts finally have a testnet launch date. David Burkett, the developer behind the subproject, announced that he had completed the implementation of blocks logic.
This means that when a “MimbleWimble block is received, it will be fully validated, added to the chain, and the UTXO set will be updated,” said Burkett.
Now, the evangelist of the privacy protocol is going to start working on the mempool to speed up the process of mining MimbleWimble blocks. He also shared a roadmap to launch the testnet by the end of the summer.
“This is all subject to change,” he said, but in June, he plans to “start mining valid chains with MW extension blocks.” By July, Burkett wants to find a way to make “different syncing approaches work smoothly together.” By the end of August the testnet should go live.
Despite the significance of the announcement, Litecoin continues consolidating within a narrow trading range. The price action of this altcoin has been contained between the $42 support level and the $49 resistance since late April.
Throughout this stagnation phase, the Bollinger bands were forced to squeeze on LTC’s 1-day chart. Wild price movements typically succeed squeezes. The longer the squeeze, the higher the probability of a strong breakout.
Since this technical index does not provide a clear path of where Litecoin could be headed next, the area between the support mentioned earlier and resistance levels is a reasonable no-trade zone. A decisive impulse outside of this area will determine the direction of the trend.
Upon the break of the overhead resistance, the next major hurdle is the 50% Fib level that sits at $54.5. Conversely, a spike in the selling pressure behind Litecoin that allows it to break below support could send it to the 78.6% Fib level at $37.5.
The Crypto Market Moving Forward
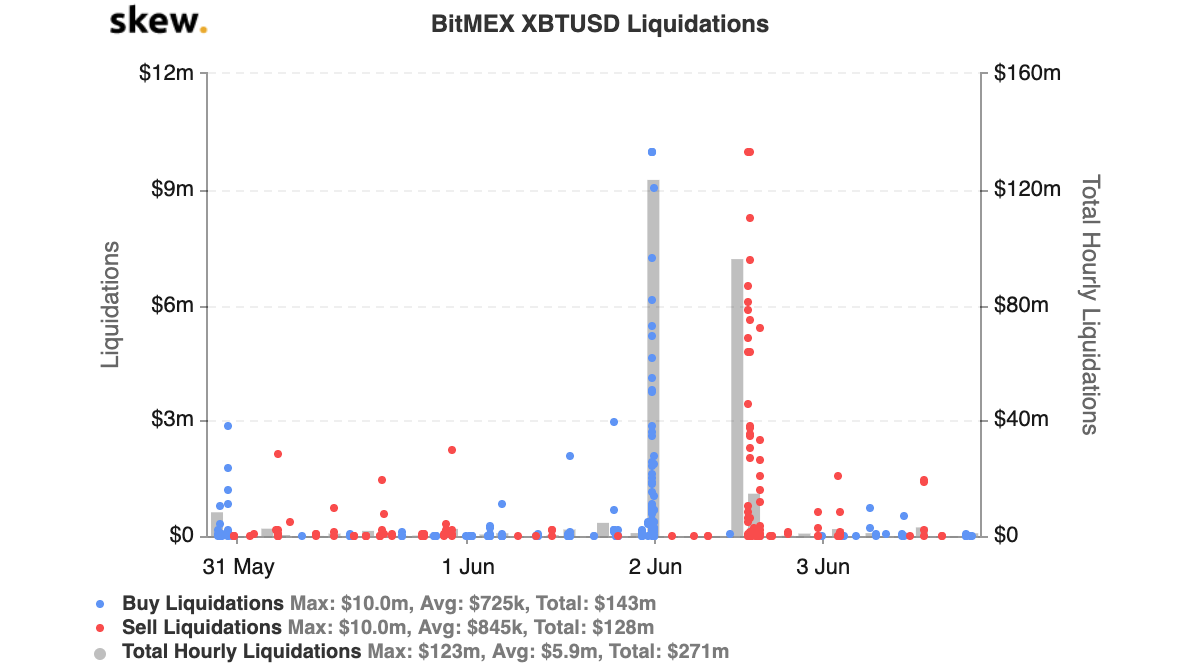
The last few days have been quite dramatic in the cryptocurrency industry. Bitcoin broke through the infamous $10,000 resistance level sending investors and market participants alike into “greed,” according to the Crypto Fear and Greed Index. But only a few hours after that happened, the bellwether cryptocurrency took a brutal $1,000 nosedive that erased these gains in a matter of five minutes.
Data from Skew reveals that this price action caused the liquidation of over $200 million worth of long and short Bitcoin positions on the crypto derivatives exchange BitMEX.
Regardless of the recent levels of volatility, the altcoins described in this analysis continue to hold above critical levels of support. If they continue to hold, these coins could lead the next bull cycle.