Bitcoin Halving Readies Ethereum, XRP, and Litecoin for Bullish Breakout
Bitcoin recorded its highest daily sentiment score since 2017. Now, it looks like this bullish sentiment is spilling over into Ethereum, XRP, and Litecoin.
Bitcoin sentiment is at its highest on record since 2017 following the halving. Positive sentiment is spilling over into Ethereum, XRP, and Litecoin as indicators show that these altcoins are ready for a bullish breakout.
Ethereum Remains Bullish Above $200
Some of the most prominent analysts in the industry have discussed the probability of a steep correction that could see Ethereum plummet to $150. However, the smart contract giant continues to hold in an ascending parallel channel that developed on its daily chart during the March market meltdown.
Since then, each time ETH rises to the upper boundary of this channel, it retraces down to hit the lower boundary, and from this point, it bounces back up again. This behavior is consistent with the characteristics of a channel.
The market-wide correction before Bitcoin’s halving sent Ethereum to the bottom of the channel. This support barrier prevented a steeper decline and allowed ETH to rebound. Now, if price history over the last three months proves accurate, Ether should rise towards the middle or upper boundary of the channel.
In addition to the ascending channel, the Fibonacci retracement indicator adds credence to the optimistic outlook. The bullish momentum over the past week allowed Ethereum to regain the 38.2% Fib as support. From this point, the next significant resistance barrier sits around the 23.6% Fib at $240.
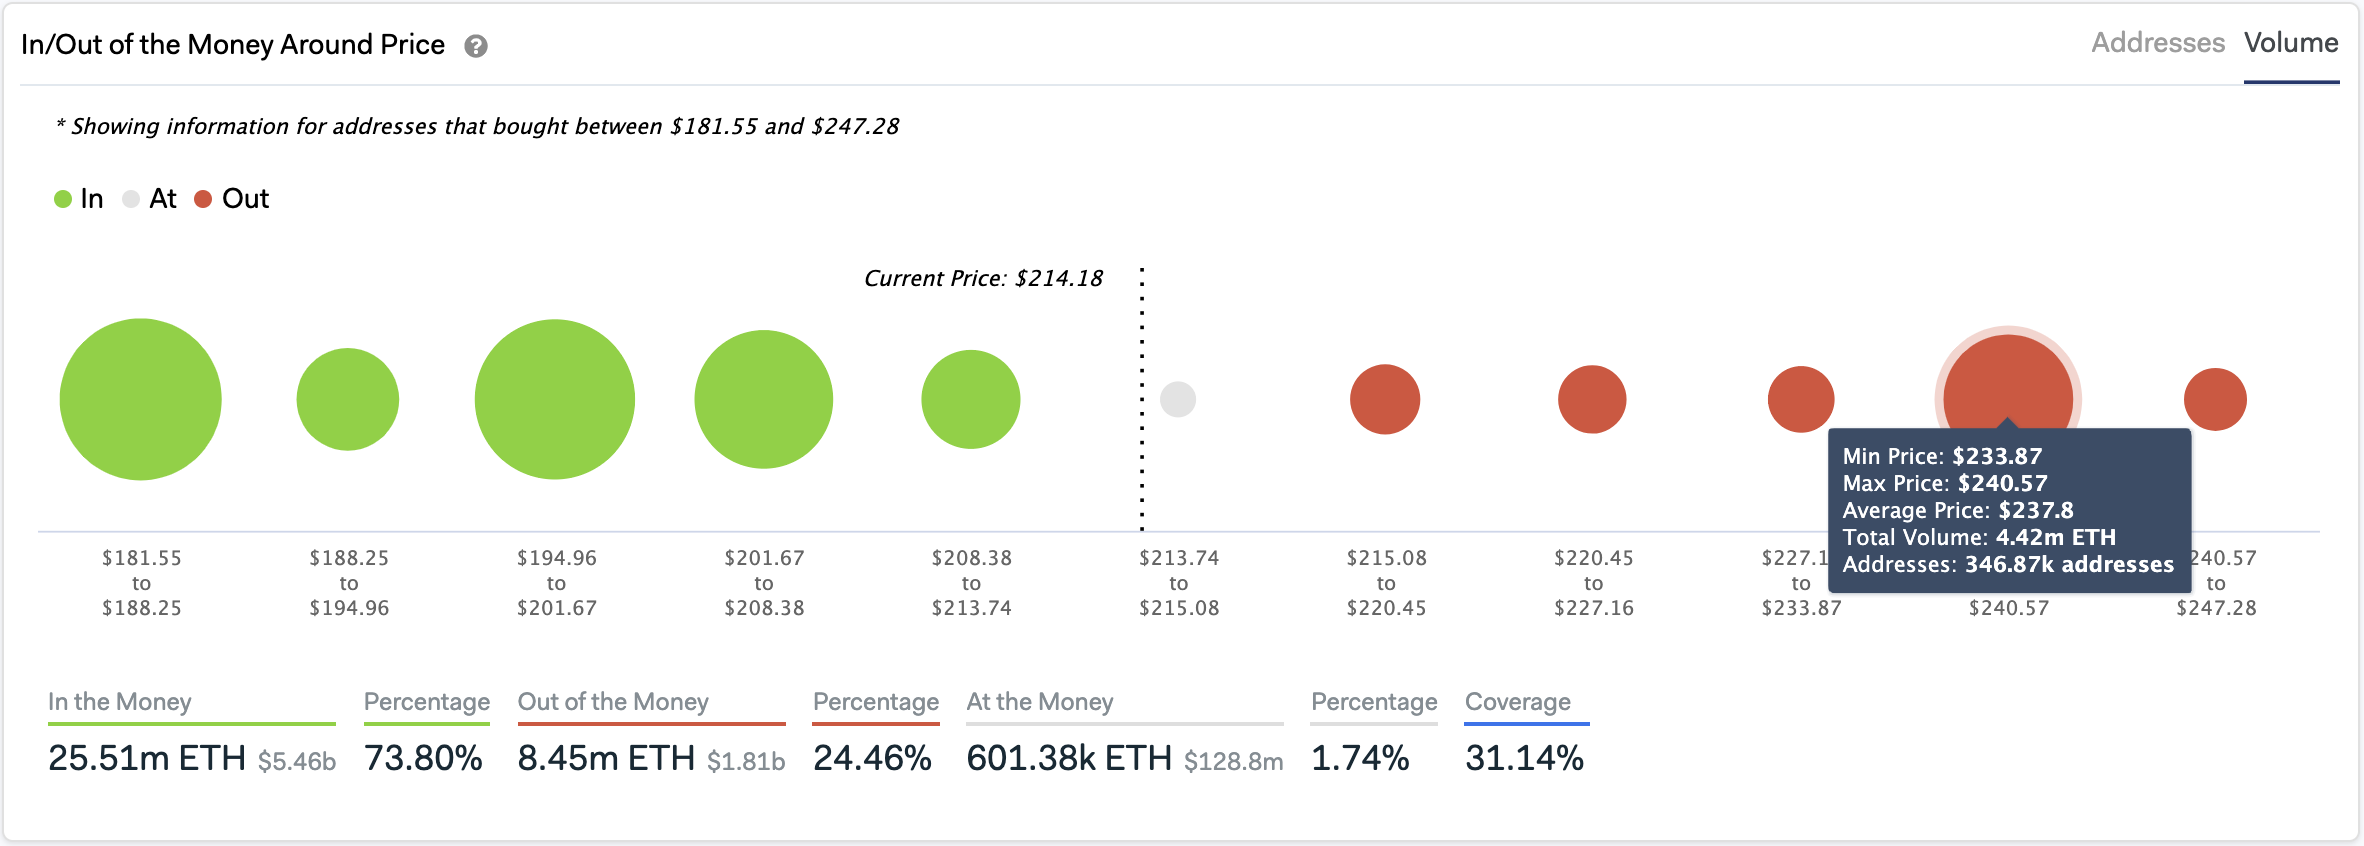
Finally, IntoTheBlock’s “In/Out of the Money Around Price” (IOMAP) model shows that more than 346,000 addresses bought over 4.4 million ETH between $234 and $240. These price levels represent a massive supply wall that will resist a further move up.
However, breaking through it may see Ether rise to $270 since there are few barriers beyond the $234-$240 one.
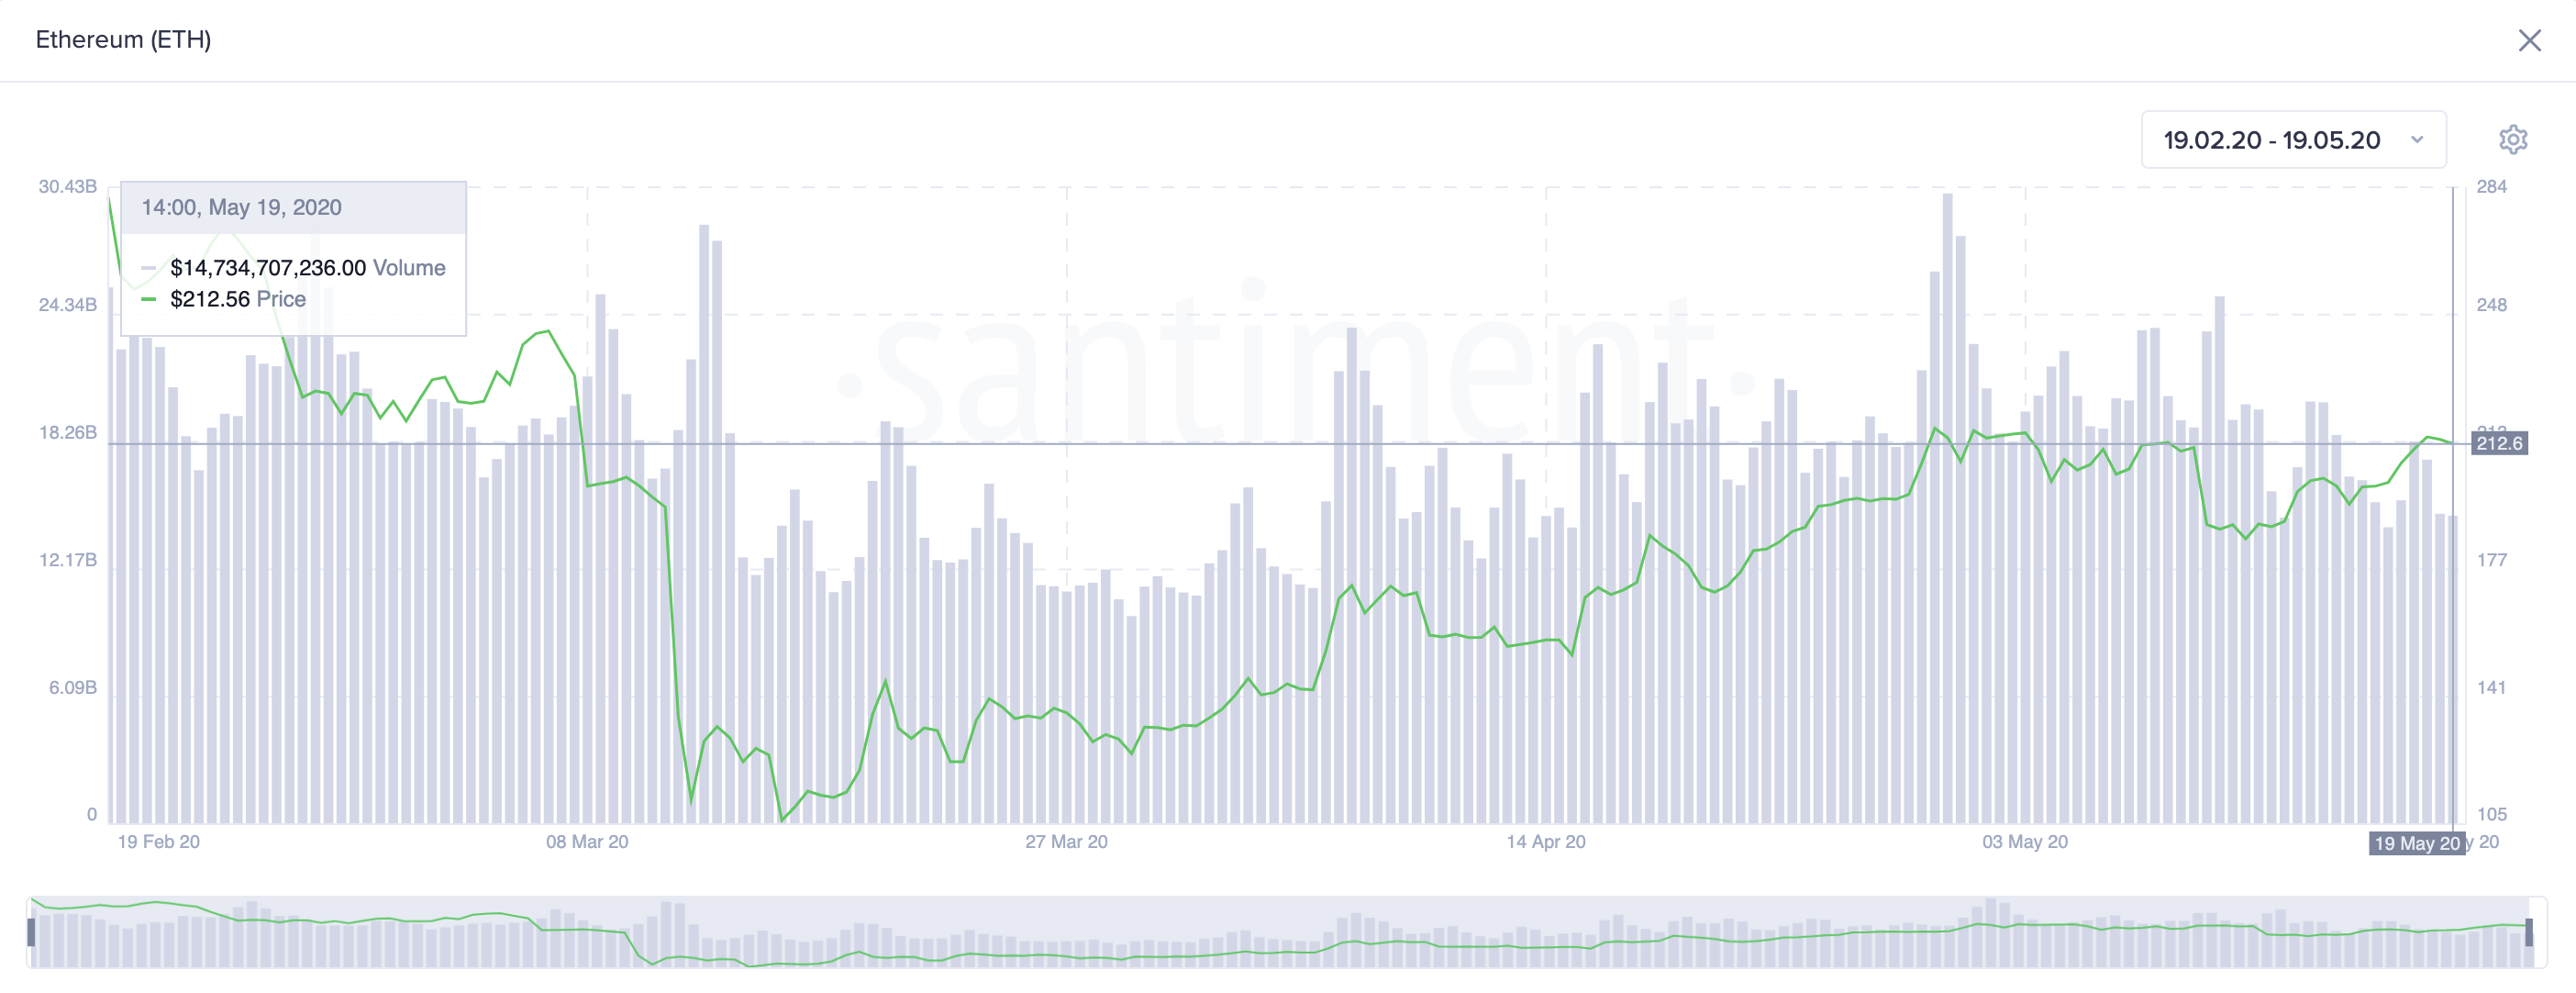
It is worth noting that Ethereum’s on-chain volume has been slowly decreasing since late April despite recent bullish price action. This divergence may indicate that “traders are not supporting this upward direction, and it is likely running out of steam,” says Santiment.
Therefore, a critical level of support to watch for rests around $200. The IOMAP indicates that 1.3 million addresses purchased 7.5 million ETH around this price level. This price is also where the lower boundary of the aforementioned parallel channel sits, which adds an extra layer of strength to this support level.
XRP Whales Start Accumulating
Even though Ripple drastically reduced its open-market XRP sales last quarter, this cryptocurrency continues to disappoint investors. A massive number of tokens entered circulation since 2016, dampening any potential upside for XRP holders.
Nonetheless, the cross-border remittances token was able to turn its 50-day moving average into support in the past couple of days, which is a reliable bullish indicator. A spike in XRP demand around the current price levels may allow it to break above its 100-day moving average, which may trigger a further increase in buying pressure.
If this were to happen, XRP could rise to retest serious resistance at the 200-day moving average.
Another curious metric is that the number of holders who own at least a million XRP, colloquially known as whales by crypto traders, has increased rapidly since March’s Black Thursday. Since then, addresses holding between 1 million to 10 million XRP have surged by more than 25%.
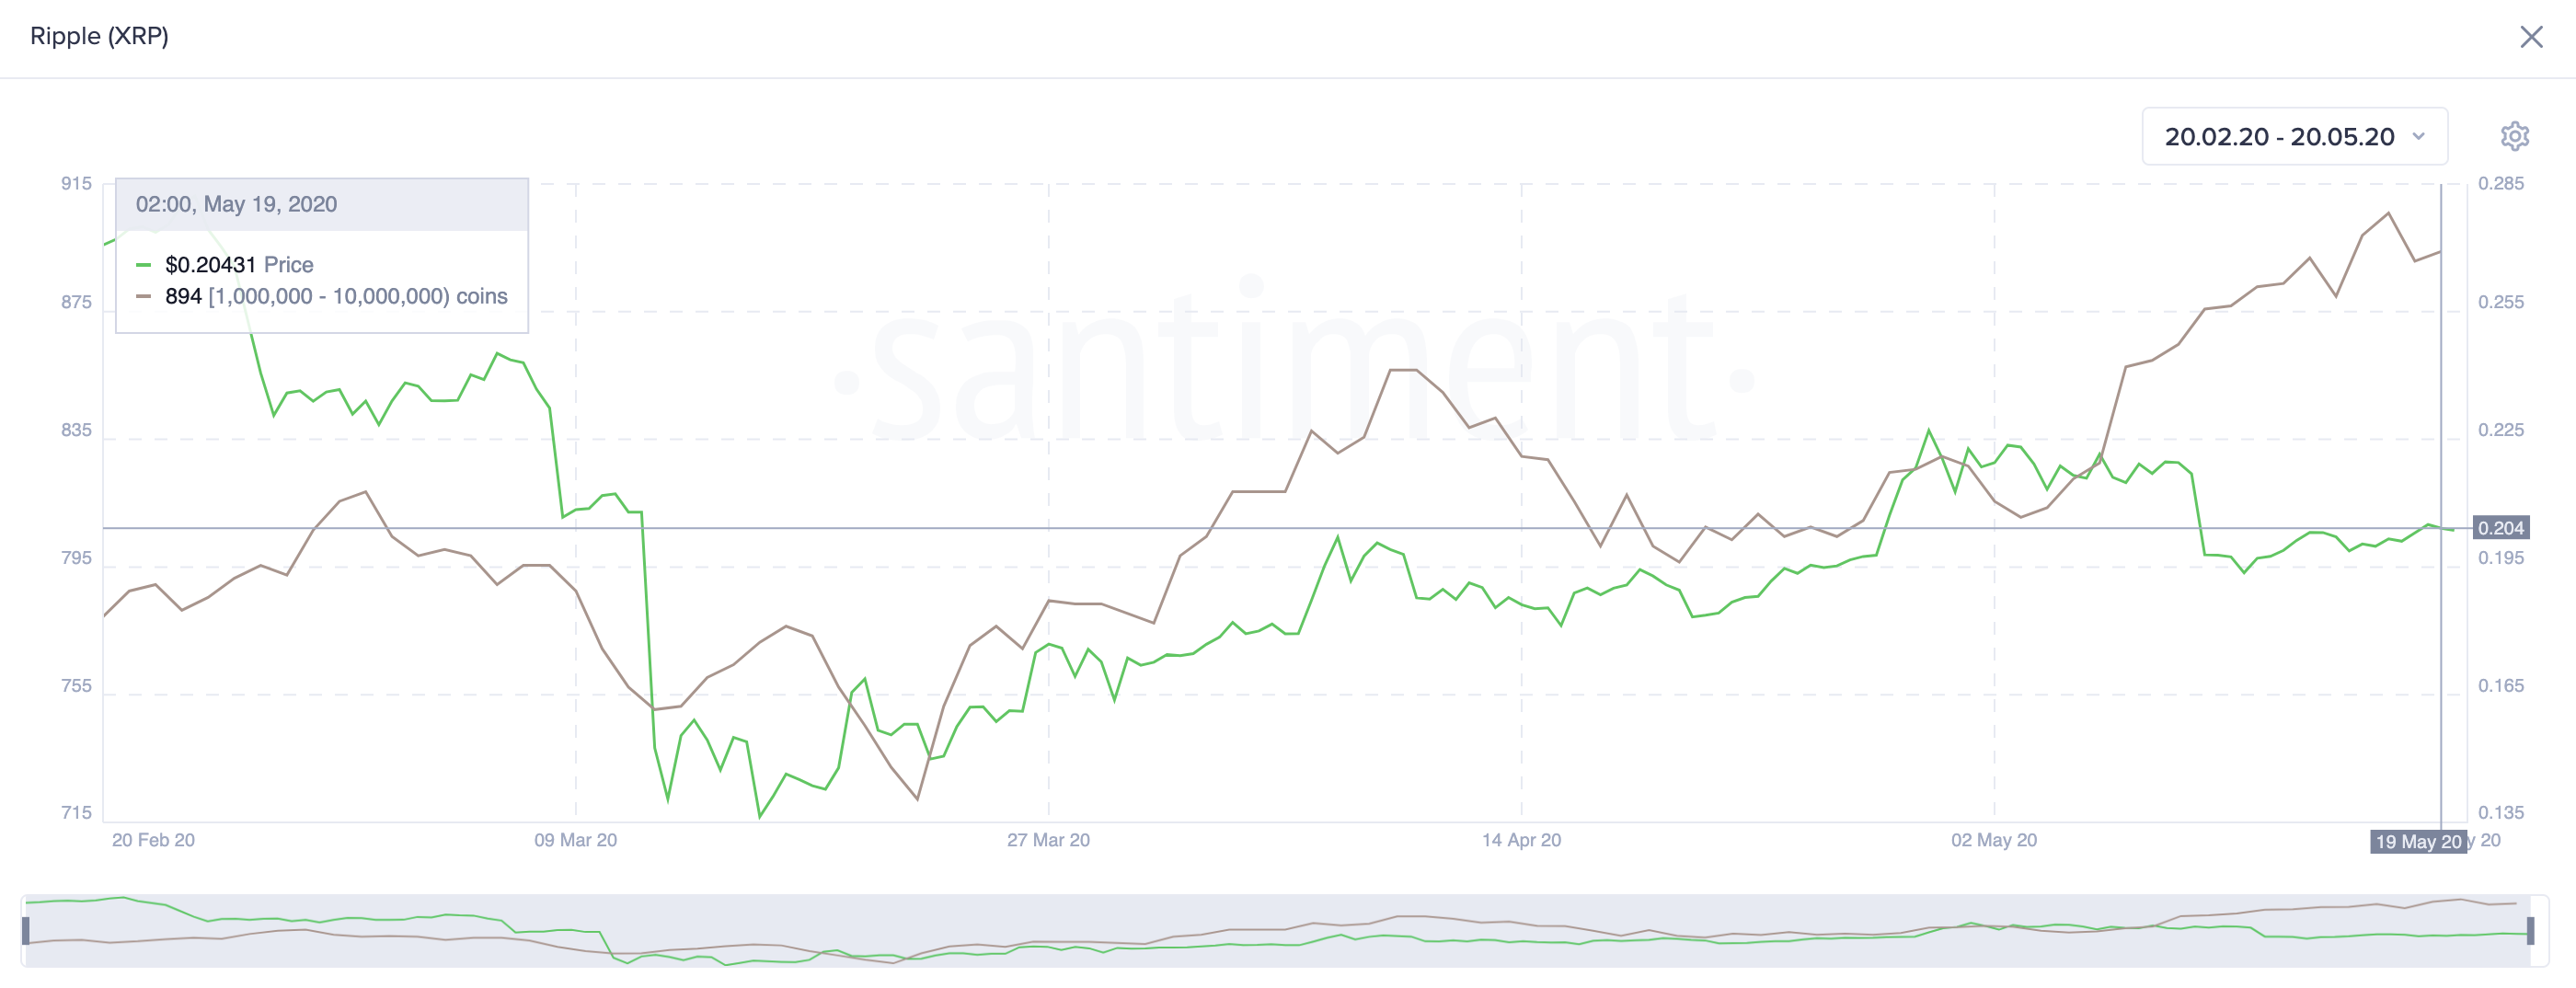
The sudden increase in XRP whales could suggest that something big is brewing behind closed doors.
Idle Litecoin Tokens on the Move
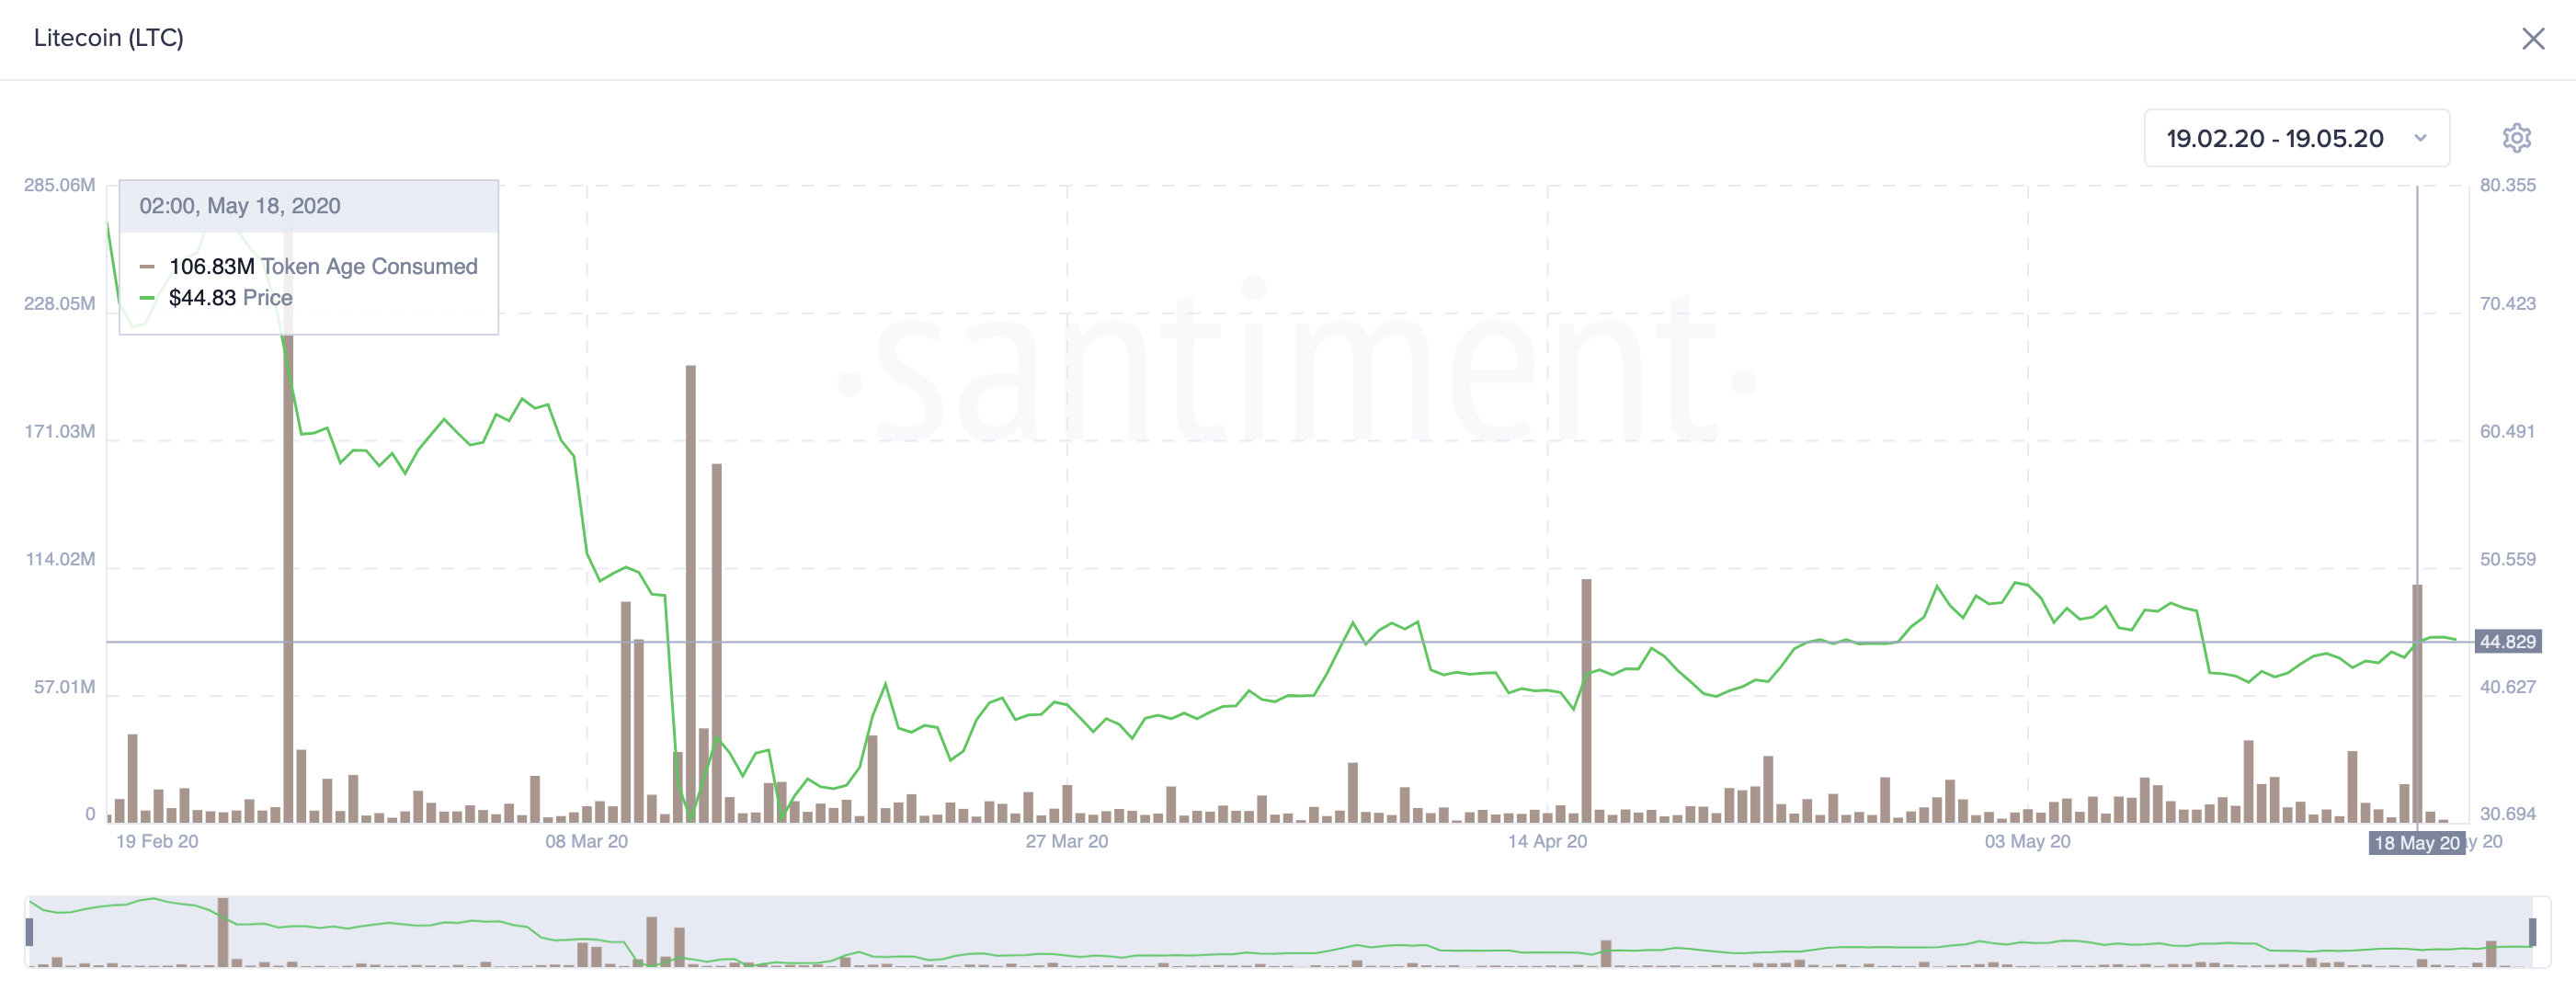
Nearly 107 million idled Litecoin tokens exchanged hands on May 18, based on Santiment’s token age consumed index. This on-chain metric measures how many coins have recently moved addresses. Although the movement of old tokens is not necessarily a leading price indicator, there has been a certain level correlation between the two data points over the past three months.
During the mid-March crash, for example, as Litecoin plummeted to a low of $25, more than 200 million idled LTC tokens moved between addresses. After that, the price of this altcoin bounced off to a high of $43.
Then, after Litecoin dropped by more than 20% on Apr. 16, the ratio of old tokens changing hands began to increase. What followed was a 17% upswing that saw LTC move back above $44.
If history tends to repeat itself, then Litecoin looks poised for a bullish impulse based on recent token movement.
Nevertheless, the daily chart reveals that the 100-day moving average could prevent LTC from advancing further. The 100-day moving average resistance level is currently hovering at around $48.
Here, the IOMAP reveals that roughly 76,500 addresses are holding nearly 1.3 million LTC. If Litecoin can overcome this supply hurdle, then LTC may surge towards $70 because resistance beyond $46-$48 starts to dwindle.
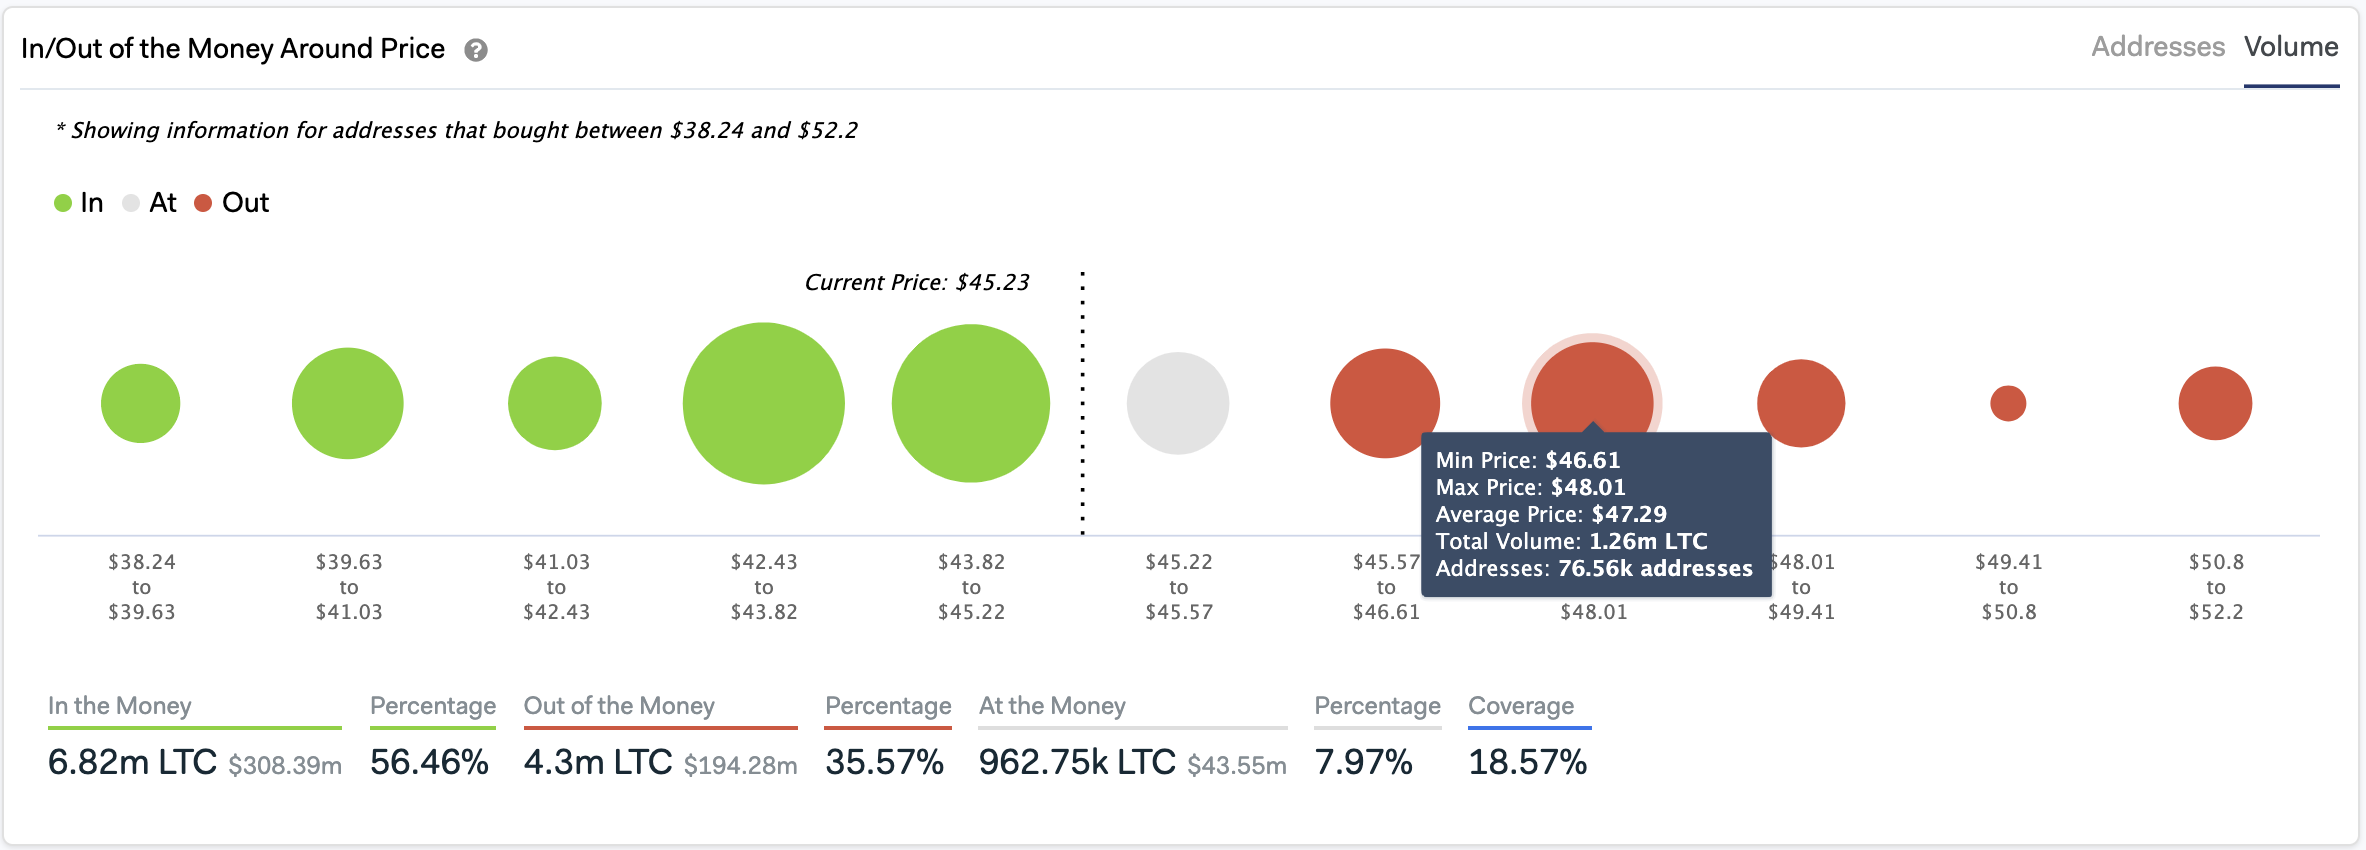
On the flip side, a break of the 50-day moving average may jeopardize the bullish outlook. A candlestick close below this support barrier implies that the bears were able to encourage more than 100,000 addresses, containing 2.5 million LTC, to sell some of their holdings. An increase in sell orders would likely result in a steep retracement.
The Crypto Market Moving Forward
Investors have grown overwhelmingly bullish following the Bitcoin halving. Data from The TIE shows that Bitcoin’s daily sentiment score is at its highest on record since 2017. Meanwhile, the Crypto Fear and Greed Index moved to a “neutral” position after sensing “extreme fear” in the cryptocurrency market for the past three months.
Since the wisdom of the crowd is not always accurate, it is important to remain cautious and wait for confirmation before entering a trade. Now that the market might be on the cusp of its next bull cycle, having cash ready to deploy is a must.
If you liked this article, check out SIMETRI for more insights into the altcoin market.