ICON Price Analysis ICX / USD: Sisyphean Task
Announcements failed to bring positive changes to ICX.
- ICON has a bearish short-term bias, with the cryptocurrency weakening below its key moving averages
- The four-hour time frame shows that the ICX / USD pair is creating bearish lower lows and lower highs
- The daily time frame shows that the ICX / USD pair has performed a bearish breakout from a sideways price channel
Fundamental Analysis
ICON has gained weak bullish momentum after the project announced that its planning to give away 3 million ICX tokens to encourage community to participate in the full node election. ICON is about to launch the first stage of its ICONSENSUS program, where its participants will vote on-chain in the election of full nodes. Pre-voting will commence on August 26.
ICON / USD Short-term price analysis
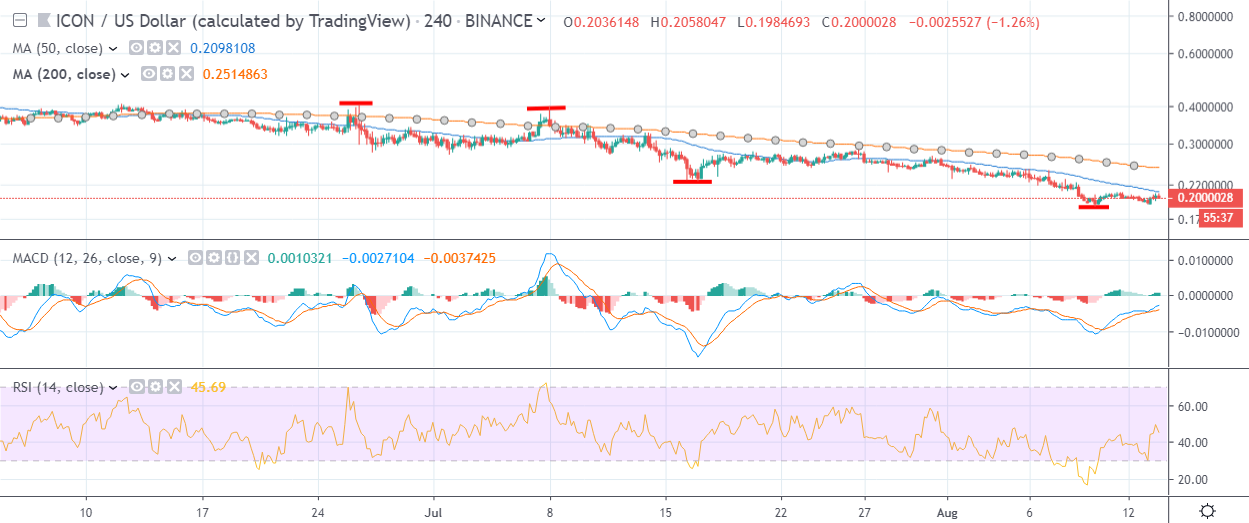
ICON has a bearish short-term bias, with the ICX / USD pair now trading below its 50-period and 200-period moving averages on the four-hour time frame.
The four-hour time frame shows that the recent bearish short-term dynamic remains in play, with the ICX / USD pair creating lower lows and lower highs.
Technical indicators on the four-hour time frame are attempting to turn bullish, although the signal remains weak.
Pattern Watch
Trading should note that the bearish range break on the daily time frame is weighing on the short-term technicals.
Relative Strength Index
The RSI indicator is attempting to turn bullish on the four-hour time frame, although momentum is weak.
MACD Indicator
The MACD indicator on the four-hour time frame is bullish and continues to issue a buy signal.
ICON / USD Medium-term price analysis
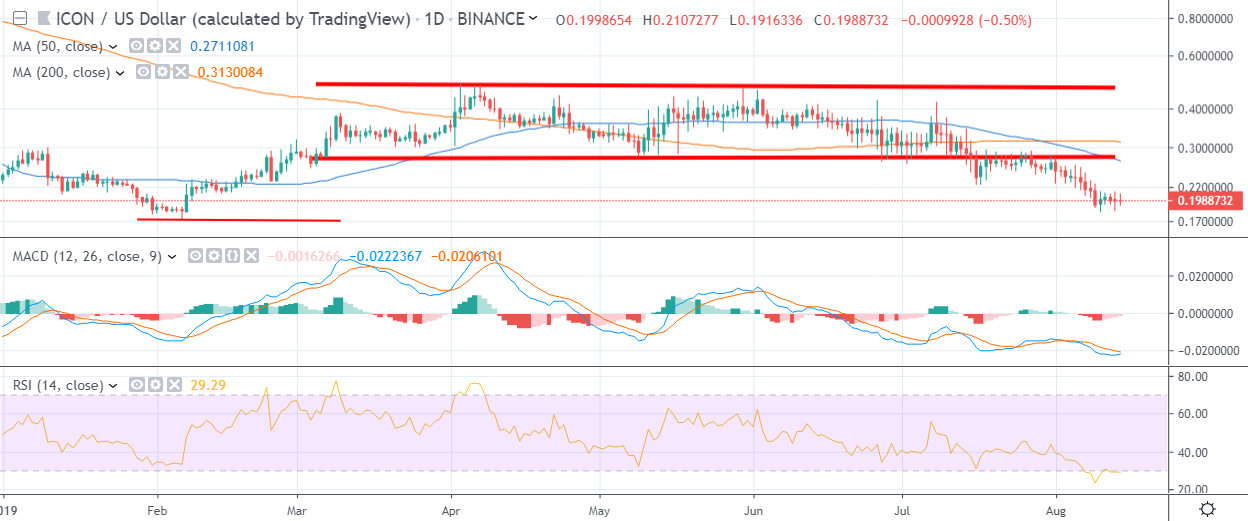
ICON has a bearish medium-term outlook, with the 50-day moving average crossing below the 200-day moving average.
The daily time frame is showing that a huge technical breakout has occurred, with ICX / USD pair moving below a sideways price channel that has been in place since March 2019.
Technical indicators on the daily time frame are bearish and are currently extremely oversold.
Pattern Watch
Traders should watch for a potential double-bottom formation if the ICX / USD pair fails to break below the February 2019 trading low.
Relative Strength Index
The RSI indicator on the daily time frame is bearish and is also extremely oversold.
MACD Indicator
The MACD indicator remains bearish on the daily time frame, although it is currently extremely oversold.
Conclusion
ICON shows few signs of staging a recovery on the four-hour time frame as the ICX / USD pair continues to post bearish lower lows and lower highs.
The breakout from the sideways channel on the daily time frame has prompted heavy technical selling, placing the current emphasis towards the February 2019 trading low.
As always, check out our coin guide for ICON, if you are looking for a brief overview.