
Market Commentary: Bitcoin Price And Hashrate Both Decline
And Ethereum keeps processing more transactions.
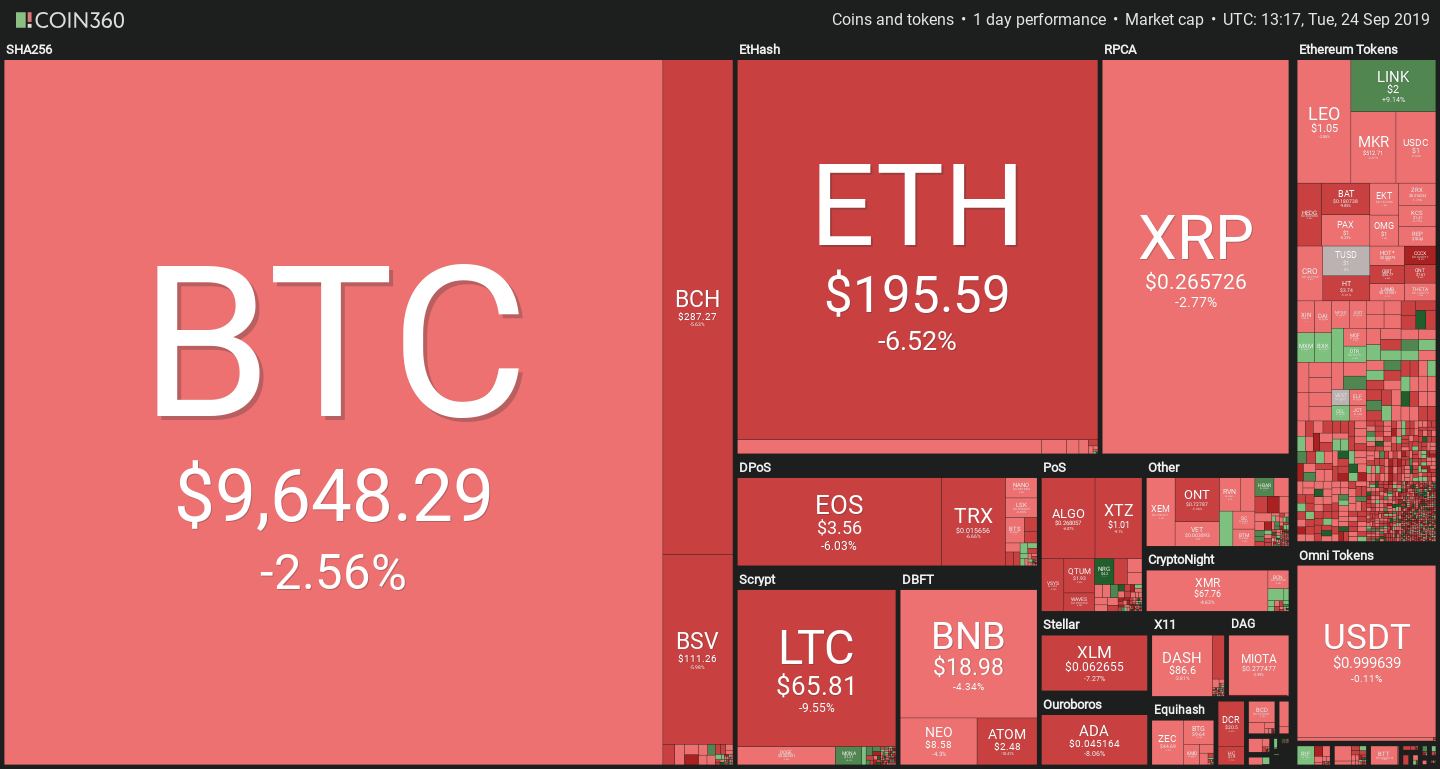
The cryptocurrency market seems to have found direction, but it might not be the one you were hoping for. The vast majority of coins are under heavy losses, ranging from 3% to lows of 10%. Bitcoin’s price appears to have fallen decisively below the $10,000 level, though the fall is relatively mild so far.
The plunge can be partially attributed to Bakkt’s predictable slow start. It falls into crypto’s peculiar behavior of selling the news: now that anticipation is gone, there are few reasons to expect another dramatic rise, leading short-term traders to sell. The only outlier among the top coins is Chainlink (LINK), which registered a sharp 8% gain so far.
Ethereum fundamentals continue to grow
ETH has had a drastic fall in the last few days, reversing nearly all of its gains to fall below $200. But price can sometimes be misleading, as Ethereum is continuing to grow in usage to unprecedented levels.
According to a report from Coinmetrics, despite a recent decision to raise the gas limit (the Ethereum equivalent of block size) on September 20, blocks continue to fill with transactions.
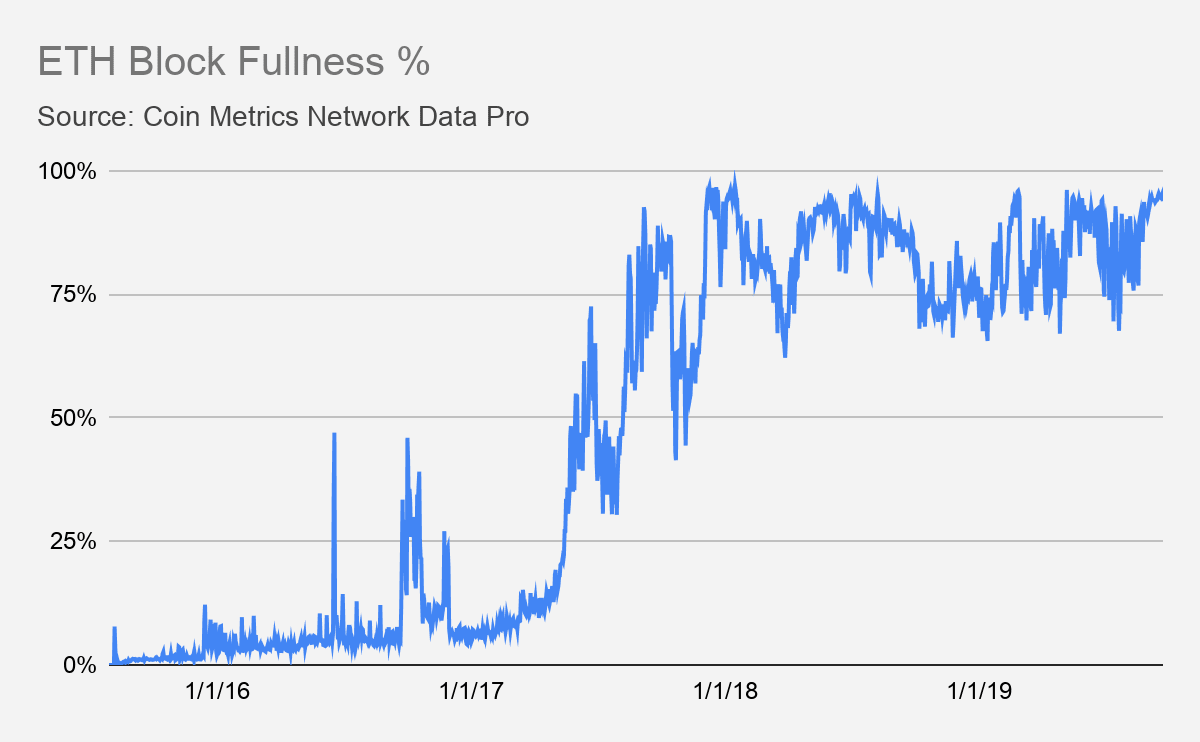
High utilization results in higher fees for dApp users, which could limit usage of the smart contracts platform – a situation that is likely to persist until the launch of Ethereum 2.0.
Bitcoin loses hefty chunk of hashrate
Flash crashes don’t just happen on exchanges: Bitcoin’s hashrate plunged 30% today after a steady rise in the previous weeks.
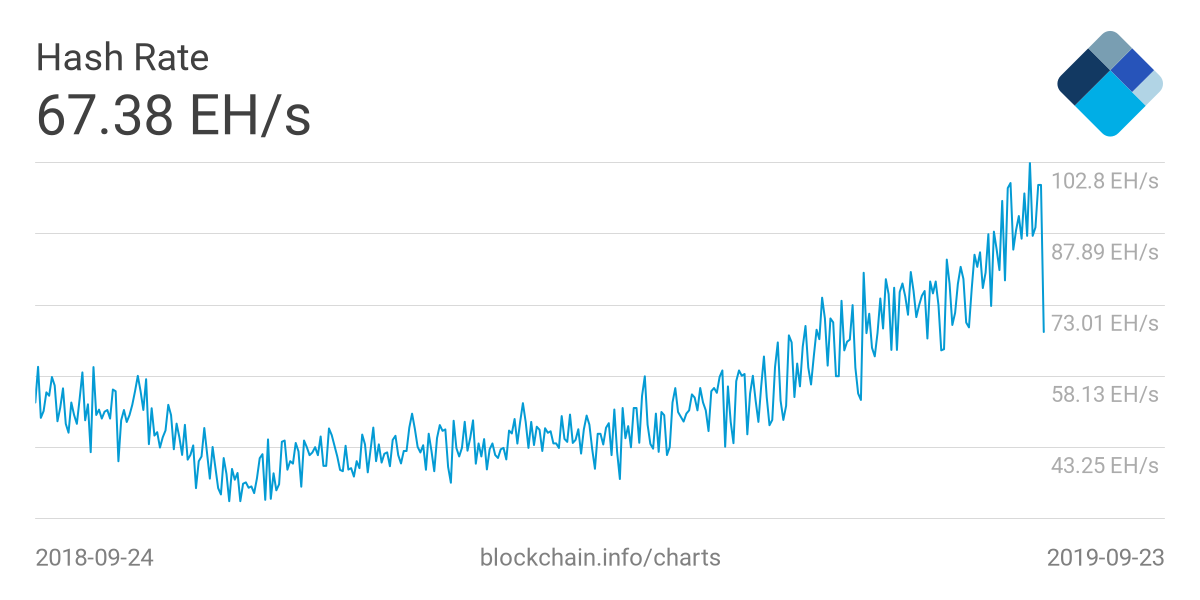
The cause isn’t immediately evident. There have been no major natural disasters in Sichuan or Irkutsk, where mining is concentrated. Hashrate by pool distribution remains relatively stable, with only a small chunk consisting of unknown miners.
A possible hypothesis is a large miner, or several smaller ones, are shutting down their old Antminer S9 ASICs. The model has been a staple of Bitcoin miners for years, until it was recently superseded by the newer S17.
As the new miners hit the market, profitability for the S9 has plunged. At today’s prices, and with a network hashrate of 100 Exahashes, the S9 makes barely 9$/mo. at $0.07/kWh. Factor in extensive cooling and servicing costs for large installations, and the operation suddenly stops being worthwhile even for those with lower electricity costs.
The sudden hashrate loss will mean that the Bitcoin network will add blocks more slowly, until the difficulty retargets in the next few days.
Chainlink surges through Binance integration
Chainlink’s 8% surge comes off its key release of Binance API integration.
A major use case for LINK’s Oracles is decentralized price discovery. As one of the leading worldwide exchanges by volume, the ability to connect to Binance APIs presents a major development for Chainlink, allowing smart contracts developed with it to factor in USD prices in their logic.
Bitcoin Price Commentary By Nathan Batchelor
The cryptocurrency market has come to life over the last twenty-four hours, pulling Bitcoin towards its current monthly trading low. Yesterday the BTC / USD pair saw a mini-flash crash, tumbling by almost $300.00 within a matter of minutes.
With the downside in focus, today I will be taking a deeper look at the potential path for a bearish breakdown in the cryptocurrency. I will also look at the total capitalization of the entire cryptocurrency market.
At present, it is by no means certain that a bearish breakdown will occur, as bulls are still successfully defending the current monthly trading low. A sustained move below the $9,600 level would be the bearish trigger for a continuation of BTC / USD selling later today.
The technicals highly suggest that the $9,300 level will be the immediate target if a break below the $9,600 level occurs. Traders should also note that a move towards the $9,300 level would invalidate the previously mentioned inverted head and shoulders pattern on the four-hour time frame, which has a strong $1,500 upside protection.
The bottom of the large descending triangle pattern on the daily time frame is found around the $9,100 level, while the BTC / USD pair’s 200-day moving average is found at the $8,350 level. A break below the $9,100 should spark heavy selling towards the 200-day moving average.
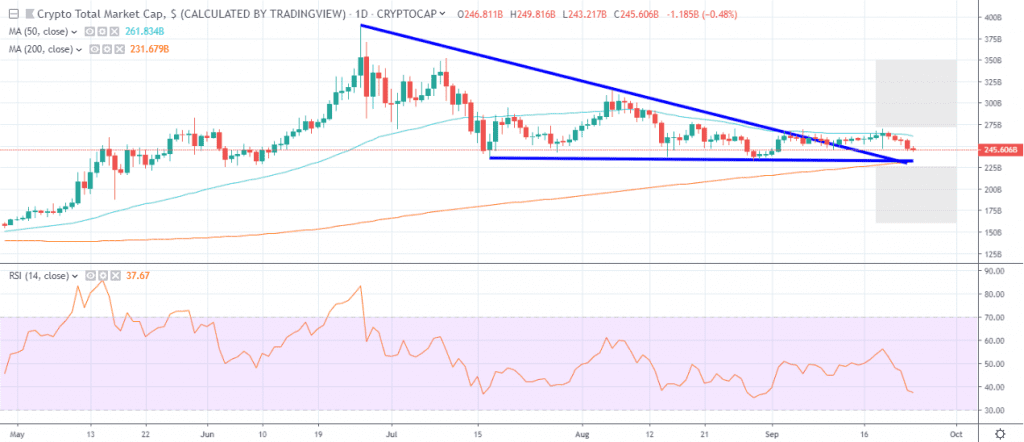
With the BTC / USD downside technicals covered, it’s time to take a look at the market capitalization of the entire cryptocurrency market. The daily time frame chart shows that the early-month rally caused a significant technical breakout from a huge descending triangle pattern.
Since the breakout, the market has gone sideways and struggled to break above its 50-day moving average. The main takeaway from the daily chart is that the bullish triangle breakout is still valid, with $230,000,000,000 the key technical region which buyers must defend.
If the entire market cap slips below the $230,000,000,000 level we should expect a widespread sell-off in the cryptocurrency market. This key technical area dominates the 200-day moving average and a bearish breakout from the descending triangle.
In summary, the recent sell-off has not changed the bullish outlook for the entire cryptocurrency market. However, a break under the $230,000,000,000 area would change it.
* It is important that BTC/USD bulls continue to defend the $9,600 level today, the cryptocurrency will struggle to regain bullish momentum if that level is broken. *
SENTIMENT
Intraday bullish sentiment for Bitcoin is very weak, at 30.00%, according to the latest data from TheTIE.io. Long-term sentiment for the cryptocurrency is unchanged, at 65.00 % positive.
UPSIDE POTENTIAL
Following yesterday’s drop, bulls need to quickly move price above the $10,000 level to move Bitcoin away from the danger zone. The four-hour time frame suggests that the $10,140 level is the key near-term resistance area which bulls need to break for the pair to regain its short-term bullish status.
The descending triangle pattern on the daily time frame is converging around Bitcoin’s monthly pivot point, once again making the $10,420 to $10,450 level a potentially explosive technical area to watch for a breakout.
DOWNSIDE POTENTIAL
As previously mentioned, the $9,600 level is the key support region to watch today. Once below this level many short-term BTC / USD bulls may throw in the towel.
Weakness under the $9,600 level is likely to trigger heavy technical selling this week, leaving the bottom of the descending triangle pattern exposed, around the $9,150 level.
A full version of Nathan Batchelor’s Daily Bitcoin Commentary, together with his calls, is available to SIMETRI Research subscribers earlier in the day.