Market Commentary: Is This Price Cycle Different?
Bakkt ain't got nothing to do with it.

Share this article
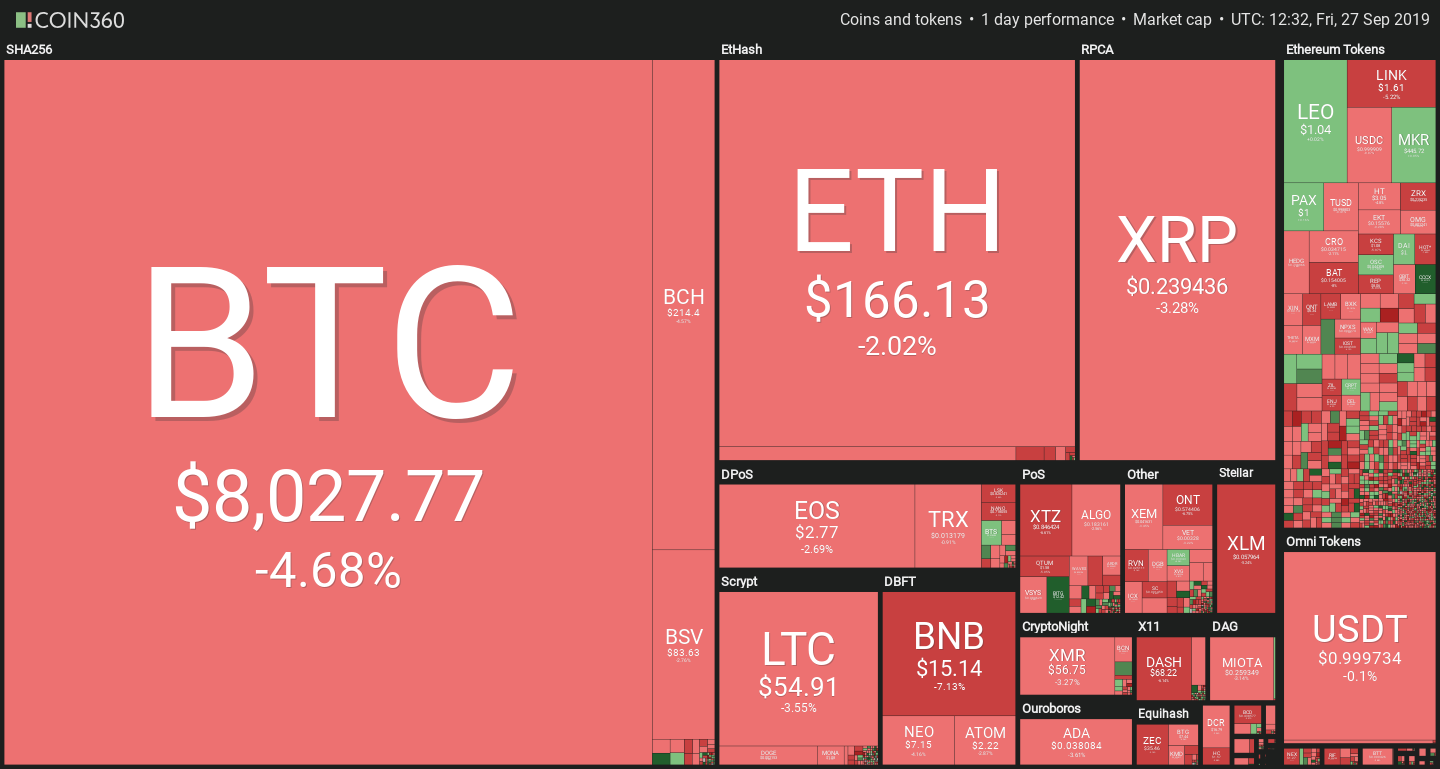
Crypto markets are again under pressure. After a short stabilization yesterday, Bitcoin resumed its slide and briefly plunged below $8000. The rest of the market followed suit, most coins showing single-digit losses with few exceptions.

Dip Or Crash?
“There are many potential reasons for the recent fall in the price Bitcoin,” says George McDonaugh, CEO of KR1, providing several possible explanations for the recent fall.
“It could be ‘selling the news’ on the launch of Bakkt, which has so far seen much lower than expected volumes of trading go through its platform following months of hype. It could also be in response to the rapid decline in Bitcoin’s hashrate (amount of computation in the system) though this now seems less likely as the hash rate has somewhat recovered.”
However, McDonaugh believes that the primary cause lies in shifting market cycles. “The truth is that markets like to test highs and lows within trading ranges,” he continued. “The cacophony of buying and selling during the adoption of a new asset looks exactly like what we’re seeing playing out with Bitcoin.”
This is likely to be small consolation for the traders who believed in an upcoming bull run, but McDonaugh offered some final words of advice for navigating the Red Sea. “Zoom out, understand how adoption cycles work, ignore the news and hold,” he urged.
Larger Than Average Losses
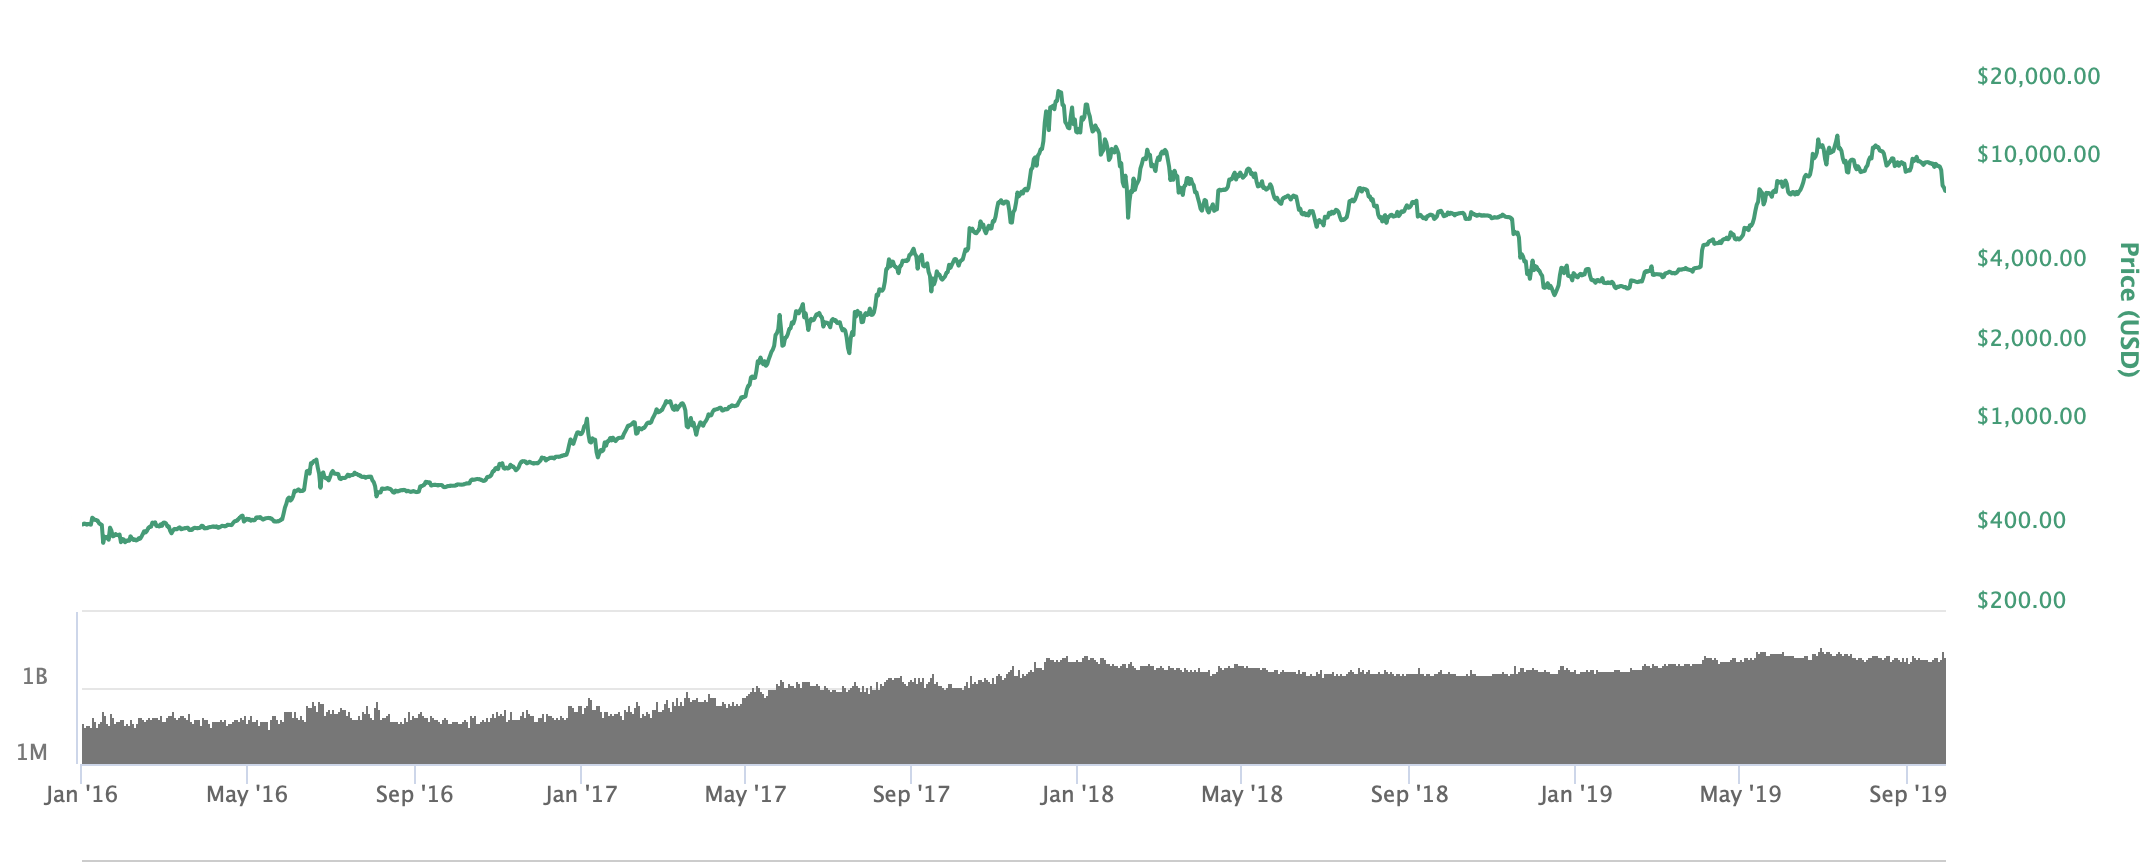
But this cycle may be different. Looking at a log-scale Bitcoin price chart, it becomes quite obvious that this year’s behavior has now deviated significantly from what happened in 2016-2017.

While corrections during the bull run of 2016-2017 occurred regularly, the falls were usually not much more than 30% from the latest high. On the other hand, the recent $13,000-to-$8,000 loss measured approximately -40%, and it might continue even further.
Overall, Bitcoin has remained more stable than during previous bull markets. A prolonged sideways trading stance actually has more in common with the final months of 2018, which followed a sharp fall not unlike what markets experienced this week. Is the 2019 bull run an oddity to be quickly corrected, or the sign of a changing market? The coming weeks will likely be crucial in determining if we are still in a bullish phase.
Binance launches staking
From October 1st, Binance users who hold certain stakeable currencies will automatically obtain the rewards that they would receive when holding coins in a wallet. Users holding NEO, ONT, XLM, KMD, ALGO, QTUM or STRAT will automatically receive staking rewards, with no further action required.
The exchange is selling this as an added value proposition, simplifying the process so that users won’t need to worry about nodes, minimum staking amounts or other requirements.
The news could have important ramifications. For currencies where staking is a significant source of revenue, it is paramount to hold them in a wallet to maintain control over the rewards. At the same time, there is a reason why despite all the warnings, a lot of people hold their funds in exchanges: it allows traders to immediately sell during volatile markets, or even set up stop-loss orders and ‘forget’ about their crypto.
With this change, it is likely that more of the supply will be available for trading on Binance, which could also result in additional selling pressure for staking projects – especially during periods of high uncertainty.
Bitcoin Commentary By Nathan Batchelor
Bitcoin is trading around the $8,000 level as we head in the U.S session trading session, with the BTC / USD pair finding strong support from just above the $7,750 level. As I mentioned yesterday, a breakout below the $8,270 level should force the cryptocurrency lower.
Various reports are circulating that price manipulation could be the cause of the latest decline in the BTC / USD. Sources suggests that Bitcoin is being pushed lower ahead of the settlement data of various futures contracts.

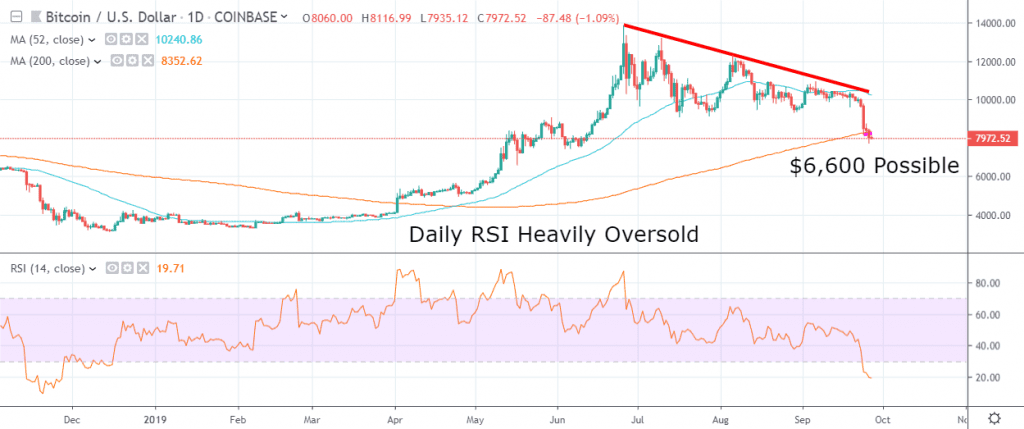
Today I would like to discuss two key developments surrounding Bitcoin that are extremely important from a technical perspective. Firstly, Bitcoin closed below its 200-day moving average for the first-time since April 2019 yesterday.
If the BTC / USD pair holds below its 200-day moving average for a second consecutive day, we should expect additional selling pressure over the weekend. The $7,500 level could be achieved fairly quickly, with the $6,600 level the likely medium-term objective.
Should we see a recovery today above the 200-day moving average, we are likely to see bulls attempting to push the BTC / USD pair back towards the $9,000 level.
I would also like to mention the daily RSI indicator reading for BTC / USD pair. The RSI indicator reading is currently below 20, which is the second-most oversold RSI reading since Bitcoin’s inception.
History has shown that once the indicator moves into extreme oversold territory on the daily time frame, it is usually accompanied by a sharp rebound higher.
* All eyes on today’s BTC/USD price close around its 200-day moving average, as it will provide a strong indication of the direction of the market over the weekend. *
SENTIMENT
Intraday bullish sentiment for Bitcoin has improved slightly, to 33.00%, according to the latest data from TheTIE.io. Long-term sentiment for the cryptocurrency has fallen marginally lower, to 63.69%, but still remains positive.
UPSIDE POTENTIAL
The key upside challenge for bulls in the short-term is found at the $8,270 level, followed by the $8,450 level. The lower time frames are also showing that a possible bullish reversal pattern may be forming.
The potential inverted head and shoulders pattern has an upside target of around $600.00, which would take the BTC / USD pair back towards the $9,000 level.
DOWNSIDE POTENTIAL
A break below the $7,750 support level today should encourage technical sellers to push the BTC / USD pair towards the $7,600 to $7,500 technical region. This is the overall near-term bearish target that I had mentioned in my previous articles.
Continued weakness below the BTC / USD pair’s 200-day moving average will encourage traders to turn medium-term bearish. The overall downside objective is likely to the BTC / USD pair’s 52-week moving average, around the $6,600 level.
A full version of Nathan Batchelor’s Daily Bitcoin Commentary, together with his calls, is available to SIMETRI Research subscribers earlier in the day.
