Stellar Lumens May Be Signaling Where Bitcoin Is Headed Next
Stellar Lumens has become a leading indicator of Bitcoin's price action since the beginning of April.

Key Takeaways
- Stellar Lumens is up more than 18% since the weekend lows of $0.059.
- If its correlation with Bitcoin continues, the recent upswing may indicate that the flagship cryptocurrency is bound for a bullish impulse.
- An increase in the buying pressure behind BTC from the current price levels could see it rise towards $9,600.
Share this article
Stellar Lumens appears to have led run-ups in the cryptocurrency market over the past month. If history repeats, Bitcoin could follow XLM’s current upward advance.
Like Stellar, Like Bitcoin
Crypto Briefing has repeatedly stated over the past couple of weeks that a unique correlation developed between Stellar Lumens’ price and the flagship cryptocurrency.
Indeed, each time Stellar posted significant gains, Bitcoin appeared to follow later on. The first time this anomaly occurred was on Apr. 5.
During that time, the bullish momentum behind Stellar rose, leading to a 7% upswing by the time BTC started surging. A couple of days later, the pioneer cryptocurrency began ticking up after XLM had already advanced 5%.
Following the aforementioned instances, the same pattern developed three more times adding credibility to its predictive power over Bitcoin’s price action.
Stellar Lumens Is Posied to Surge
Stellar Lumens has now entered an upward impulse that has seen it recover most of the losses incurred over the weekend in a market-wide correction. The recent price action led to the formation of a buy signal based on the TD sequential indicator.
The bullish pattern developed in the form of a red nine candlestick on XLM’s 1-day chart. A further increase in the buying pressure behind this cryptocurrency could validate the buy signal presented by the TD setup.
Under such circumstances, the cross-border transactions token may be bound for a one to four candlesticks upswing or the beginning of a new upward countdown.
A candlestick close above the 23.6% Fibonacci retracement level will signal a move towards the mid-February high of $0.09. On the flip side, the 38.2% Fibonacci retracement level must hold for the continuity of the uptrend.
History Is Doomed to Repeat Itself
It is uncertain how much trust can be put into Stellar leading Bitcoin’s price, but the recent history suggests that a lot.
One could expect that BTC may break out sooner than later now that XLM is up over 18% from the weekend’s swing low.
The Bollinger bands on BTC’s 4-hour chart add credence to this bullish outlook. As these bands have begun to squeeze, a period of high volatility has been building up.
A candlestick close above the 50% Fibonacci retracement level can be used as confirmation of the optimistic scenario. Moving past this resistance level may see Bitcoin advance towards the next supply barriers around the 38.2% and 23.6% Fibonacci retracement levels.
These areas of resistance sit at $9,300 and $9,600, respectively.
Nevertheless, a spike in the selling pressure behind Bitcoin would see it plummet to the 61.8% Fibonacci retracement level. Breaking below this support wall could put in jeopardy the bullish outlook sending BTC to $8,400.
Moving Forward
Bitcoin has made major headlines as of late thanks to the latest halving and billionaire Paul Tudor Jones’ announcing his investing 2% of his capital in BTC.
As the pioneer cryptocurrency becomes more scarce, Coin Metrics also pointed out that Bitcoin’s supply on exchanges is dropping rapidly.
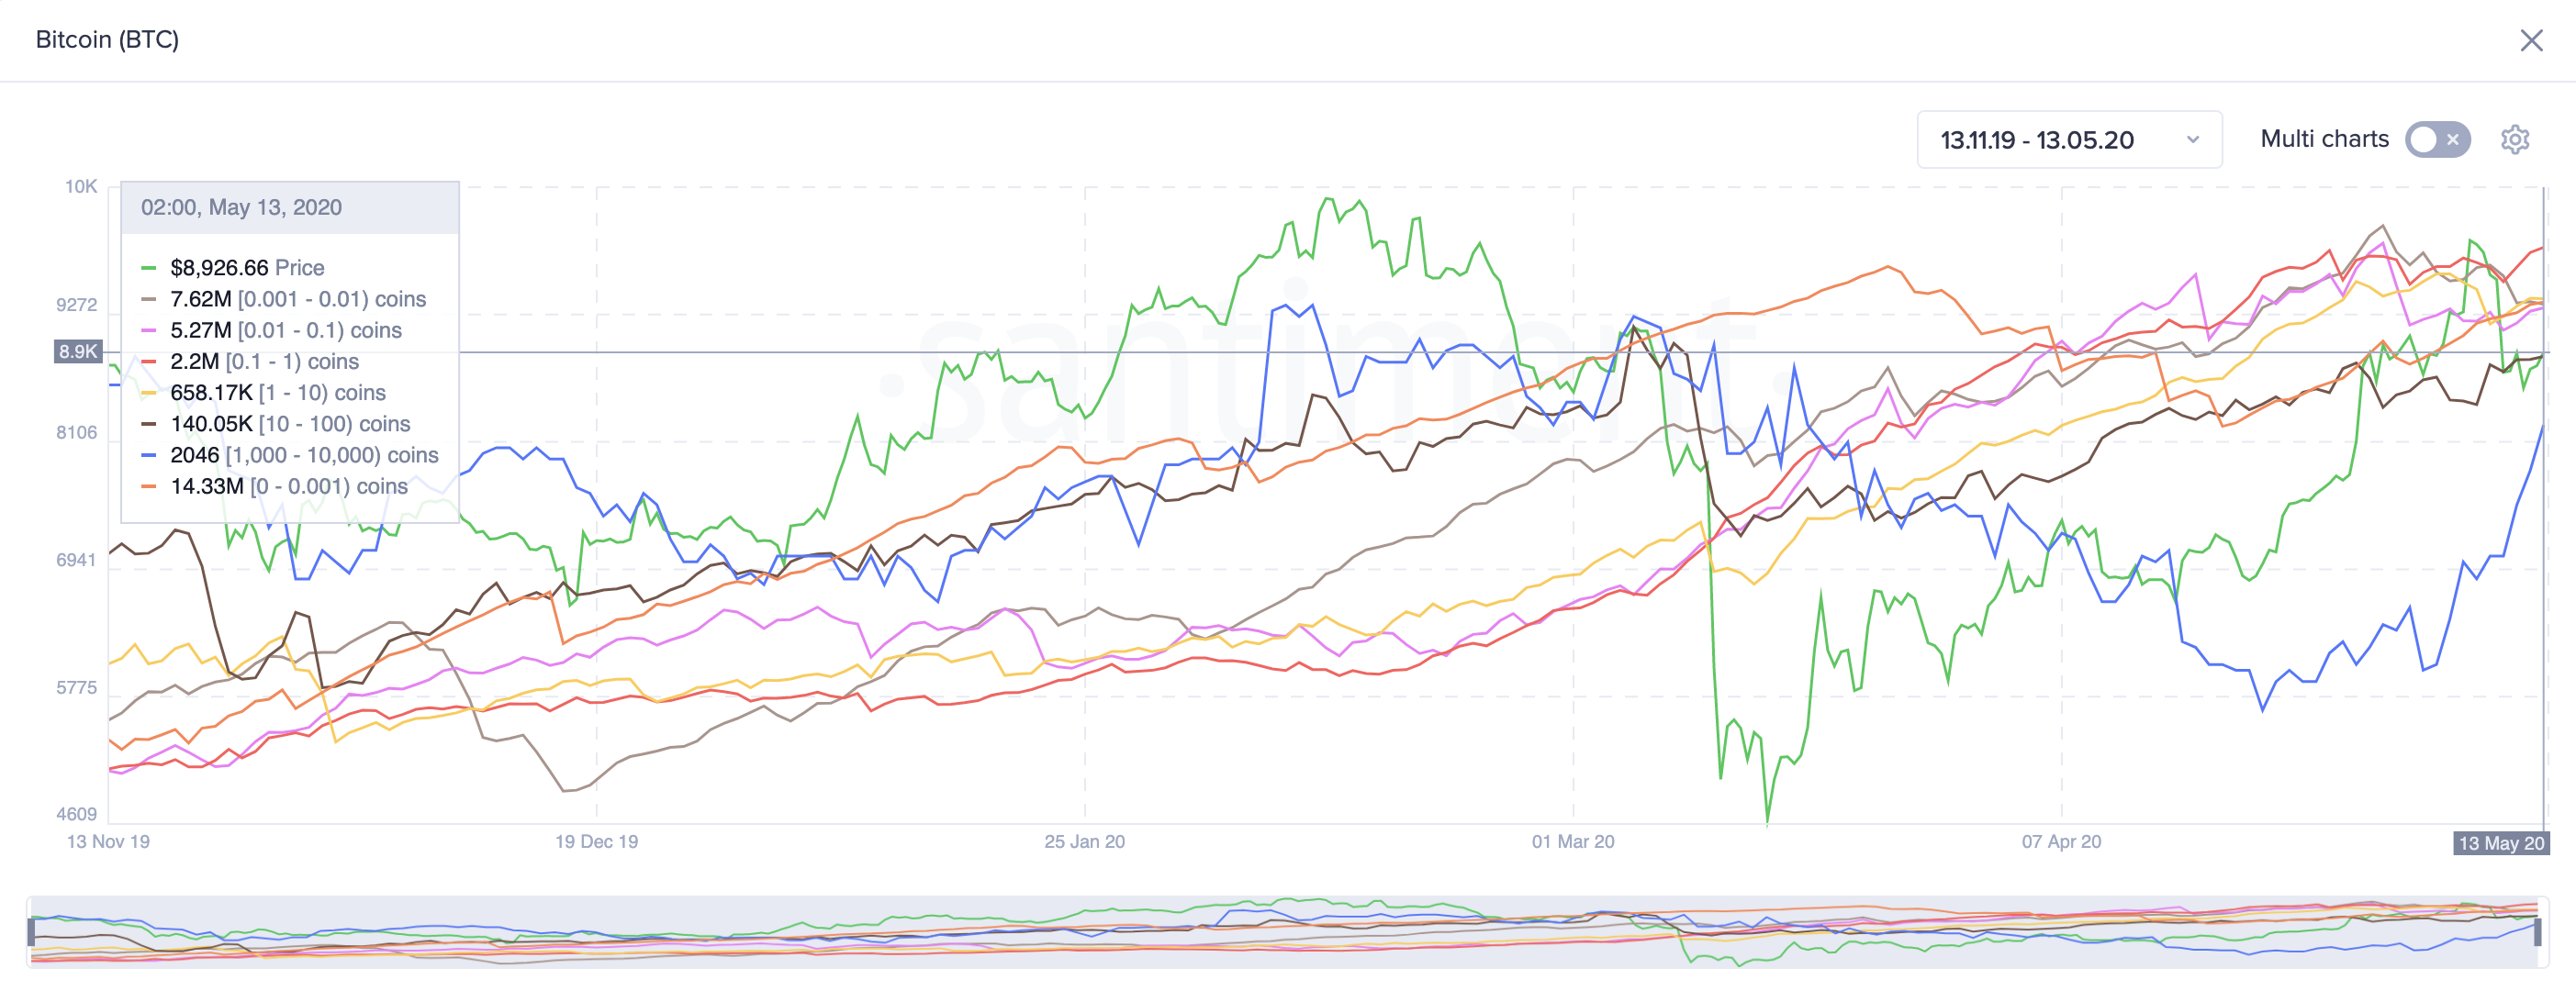
Meanwhile, the number of BTC holders is rising at an exponential rate. Data from Santiment reveals that retail investors with 0.001 to 100 BTC have been accumulating heavily over the past six months. And, the number of big players with 1,000 to 10,000 BTC have also started increasing.

Now, it is just a matter of time before the price of Bitcoin starts to feel the effects of the recent supply shock. And with Stellar Lumens tracking upwards, these effects could be bullish.
Share this article
