
VeChain Price Analysis VET / USD: Rising Star
VeChain turned bullish due to an important partnership.

Share this article
- VeChain has a bullish short-term trading bias, with the cryptocurrency advancing to a fresh 2019 price high
- The four-hour time frame shows that a strong bullish breakout has occurred
- The daily time frame is showing that multiple bullish patterns have been triggered
Fundamental Analysis
VeChain has surged after the project announced the launch of the Walmart China Blockchain Traceability Platform, built on the VeChainThor Blockchain. The platform was built in cooperation with Walmart China, China Chain-Store & Franchise Association (CCFA), PwC, Inner Mongolia Kerchin Co., Ltd. It will help Walmart China to implement a traceability strategy for products, and further support the adoption of VeChain.
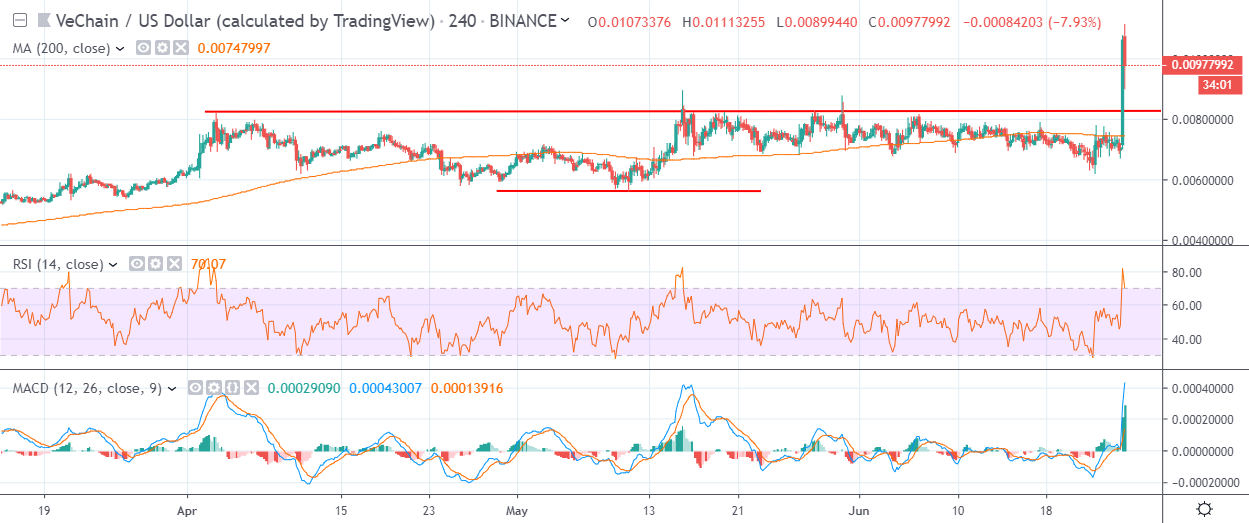
VeChain / USD Short-term price analysis
VeChain has a bullish short-term outlook, with the cryptocurrency trading at its highest level since early November 2018.
The four-hour time frame is showing that an inverted head and shoulders pattern has been triggered, with the bullish pattern already reaching its overall upside potential.
Technical indicators on the four-hour time frame are overstretched but remain bullish.
Pattern Watch
Traders should note that the VET / USD pair could start to reverse now that it has reached its overall upside target.
Relative Strength Index
The RSI indicator on the four-hour time frame remains bullish, although it is starting to correct from overbought territory.
MACD Indicator
The MACD indicator on the four-hour time frame is bullish, although it is starting to appear extremely overstretched.
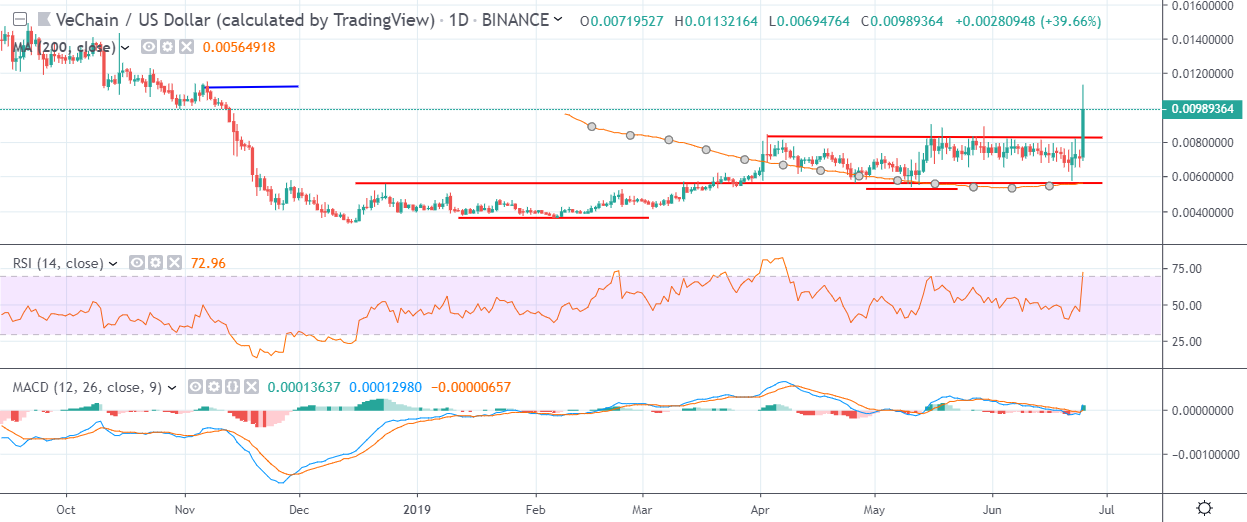
VeChain / USD Medium-term price analysis
VeChain has a bullish medium-term trading outlook, with the VET / USD pair performing a major technical breakout on the daily time frame.
The daily time frame is showing that multiple inverted head and shoulders patterns have been triggered, with both patterns already reaching their full upside targets.
Technical indicators on the daily time frame are bullish and continue to issue buy signals.
Pattern Watch
Traders should note that a much larger inverted head and shoulders pattern could form if bulls can hold price around November 2018 trading high.
Relative Strength Index

The RSI indicator on the daily time frame is bullish, although it has now reached overbought conditions.
MACD Indicator
The MACD indicator is bullish on the daily time frame and continues to issue a strong buy signal.
Conclusion
VeChain has performed a major breakout rally on both time horizons, with the cryptocurrency igniting multiple bullish patterns in the process.
Buyers now need to keep the cryptocurrency around the November 2018 trading high to encourage the formation of a much larger bullish pattern across the daily time frame.
For a quick look into VeChain and VET, check out our coin guide here.
If you need a deeper analysis, look into our VeChain DARE.
Share this article
