VET / USD Price Analysis: Consolidation Period
VeChain is in a precarious position, as it needs to make continuous weekly gains to remain bullish.

Share this article
- VeChain has a bullish short-term bias, with the cryptocurrency continuing to trade above major technical support
- The four-hour time frame shows a bullish descending triangle breakout in progress
- The inverted head and shoulders pattern on the daily time frame has now reached its upside target
VeChain / USD Short-term price analysis
VeChain has a bullish short-term outlook, with the cryptocurrency continuing to hold price above major technical support on the four-hour time frame.
The four-hour time frame is also showing a bullish descending triangle pattern breakout in progress, with buyers edging the VET / USD pair above the price pattern.
Technical indicators on the four-hour time frame are still bullish and continue to signal further upside.
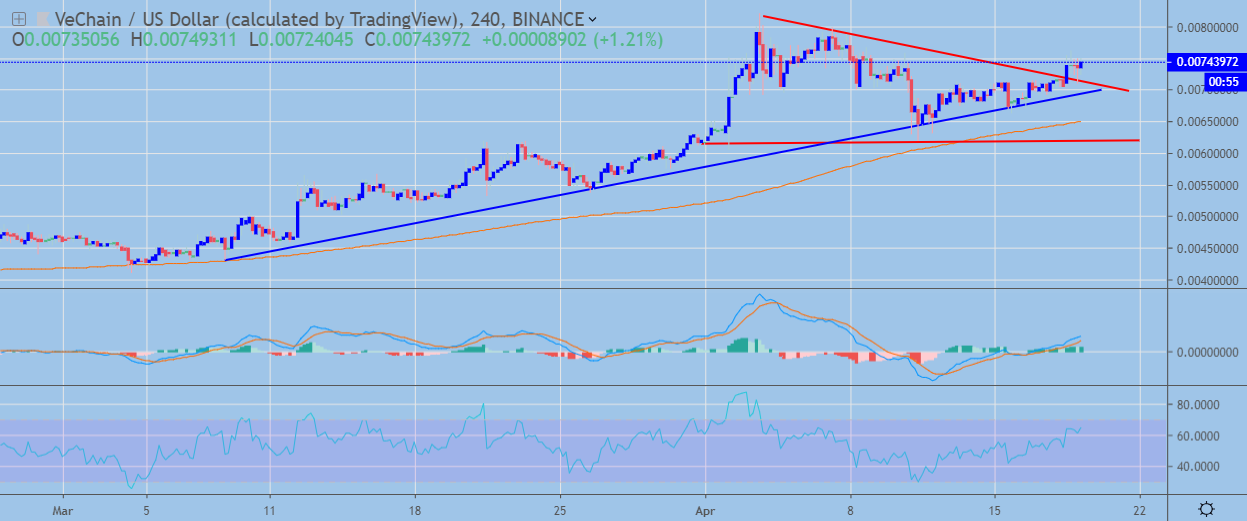 VET / USD H4 Chart by TradingView
Pattern Watch
Traders should note that a small inverted head and shoulders pattern could start to form on the four-hour time frame if buyers rally the VET / USD pair to a new 2019 trading high.
Relative Strength Index
The RSI indicator on the four-hour time frame is also bullish and is pointing to further near-term upside for the VET / USD pair.
MACD Indicator
The MACD indicator on the four-hour time frame is currently bullish, with the MACD signal line generating a strong buy signal.
VeChain / USD Medium-term price analysis
VeChain has a bullish medium-term trading outlook, with the cryptocurrency now consolidating above its trend defining 200-day moving average.
The bullish inverted head and shoulders pattern has now reached its overall target, with the November 14th, 2018 swing-high now offering the strongest form of upside resistance.
Technical indicators are bullish on the daily time frame and are currently conflicted as the VET / USD pair enters into a period of consolidation before its next directional move.
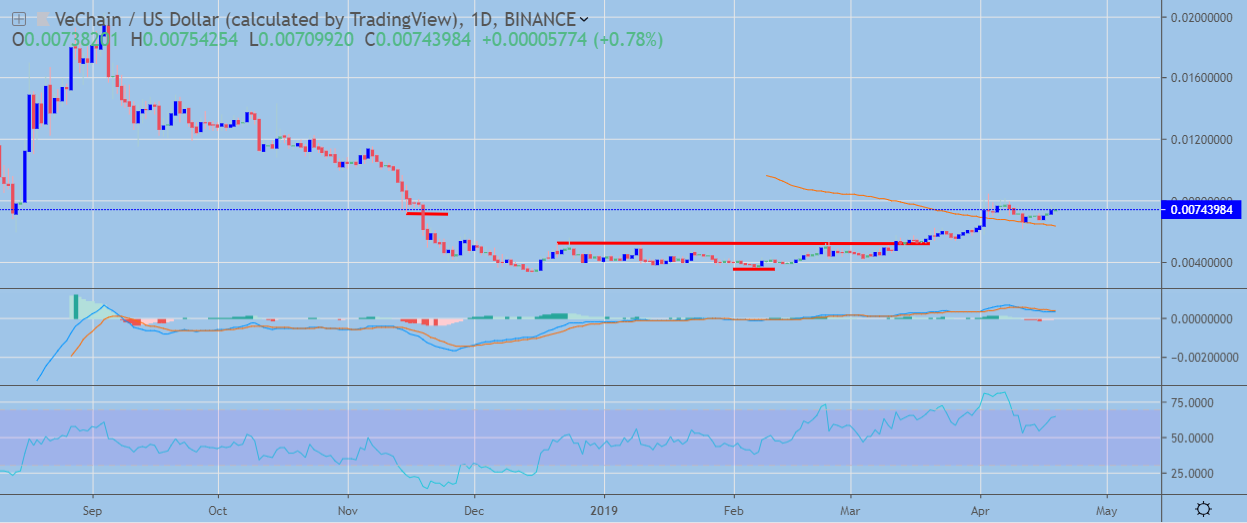 VET / USD Daily Chart by TradingView
Pattern Watch
With the absence of any bullish patterns on the daily time frame, it is important that VET / USD pair continues to make higher weekly highs to maintain the recent bullish momentum.
Relative Strength Index
The RSI indicator on the daily time frame remains bullish, although a bearish head and shoulders pattern is present.
MACD Indicator
The MACD indicator is conflicted on the daily time frame, with the MACD signal line turning lower while the MACD histogram corrects higher.
Conclusion
VeChain has entered into a period of price consolidation following its recent multi-month move to the upside. The cryptocurrency will need to maintain upside pressure in the near-term or it could be at risk of a strong bearish technical correction given its recent strong rally.
Our coin guide is an excellent resource to get an introduction to the project.
We also analyzed the prospects of the project and its industry in our DARE.
Share this article
