VET / USD Price Analysis: Overcoming Selling Pressure
The pair is coming under technical selling pressure on the edge of its moving averages, but other indicators are bullish.

Share this article
- VET has a bearish short-term trading bias, with the cryptocurrency trading below its 200-period moving average on the four-hour time frame
- The VET / USD pair continues to trade above its 200-day moving average
- The daily time frame is showing that the VET / USD pair has fallen below key trendline support
VET / USD Short-term price analysis
VET has a bearish short-term outlook, with the cryptocurrency now trading below its 200-period moving average on the four-hour time frame.
The four-hour time frame is also showing that a large head and shoulders pattern is starting to take shape. Bulls need to move price above the April 19th swing-high to invalidate the bearish pattern.
Technical indicators on the four-hour time frame have turned bullish and signal a potential upside.
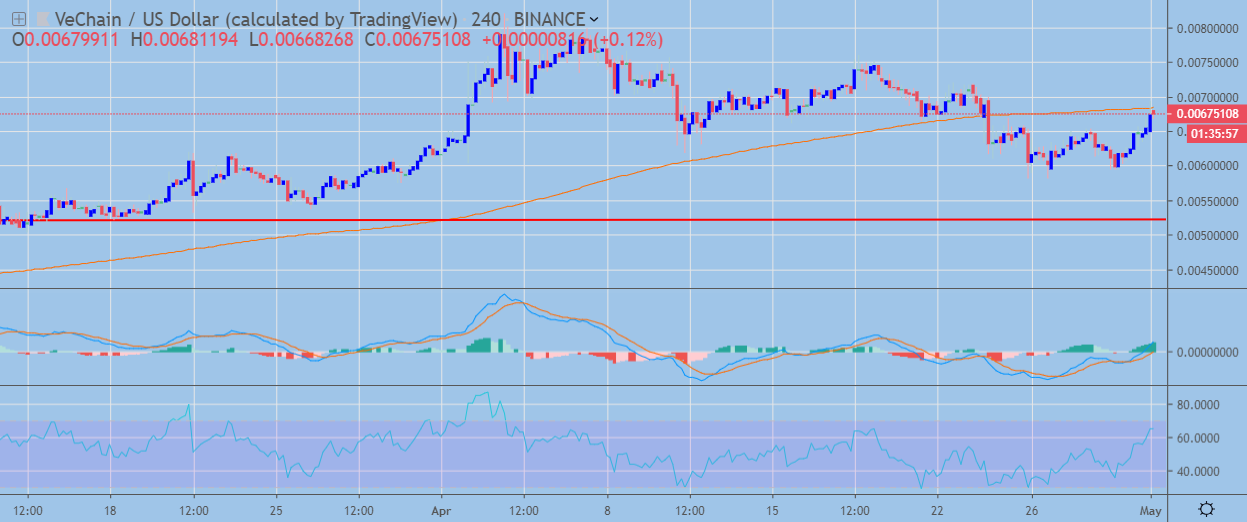 VET / USD H4 Chart by TradingView
Pattern Watch
Traders should note that the VET / USD pair will fall towards its current 2019 trading low if the head and shoulders pattern is triggered.
Relative Strength Index
The RSI indicator on the four-hour time frame is bullish and is showing scope for future upside.
MACD Indicator
The MACD indicator on the four-hour time frame is currently bullish, with the MACD signal line and MACD histogram both generating strong buy signals.
Fundamental Analysis
VET has been up for the past several weeks with some positive news. During the VET Summit in San Francisco, the company has announced that it is working with BMW on building the VerifyCar app which addresses the mileage fraud problem present in one-third of vehicles in Germany. Deloitte has also announced that it will develop a blockchain solution based on VEThor and migrate from the Ethereum network.
VET / USD Medium-term price analysis
VET has a bullish medium-term trading outlook, with the VET / USD pair still trading above its trend-defining 200-day moving average.
The daily time frame is showing that the VET / USD pair has started to come under technical selling pressure after price fell below key trendline support.
Technical indicators on the daily time frame are attempting to correct higher following the recent decline in the VET / USD pair.
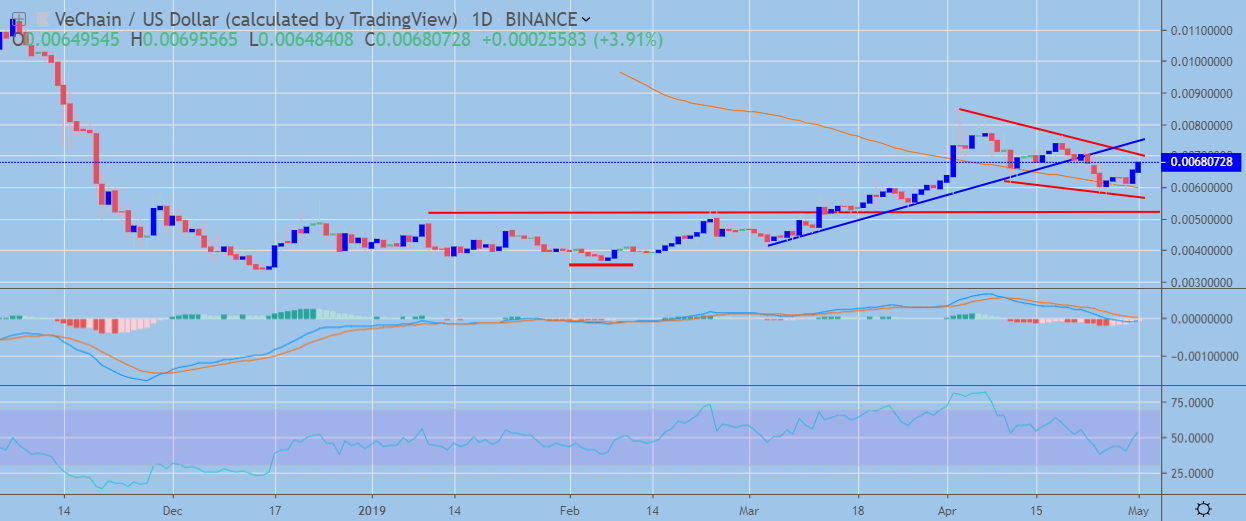 VET / USD Daily Chart by TradingView
Pattern Watch
Traders should note that a valid falling wedge pattern is also present on the daily time frame.
Relative Strength Index
The RSI indicator on the daily time frame has started to turn bullish and shows scope for further upside.
MACD Indicator
The MACD indicator is neutral on the daily time frame, with the MACD indicating currently failing to generate a clear trading signal.
Fundamental Analysis
VET has shown strong fundamentals at the beginning of 2019 which should positively affect the adoption of its network. The team continues to develop strong partnerships and is starting to present working products that utilize its blockchain. These factors should help the project to grow in the medium-term.
Conclusion
VET is attempting to recover higher after relinquishing a portion of its recent gains. Short-term bulls will need to work hard to negate the bearish pattern on the four-hour time frame, while the daily time frame is showing that buyers must move price above key trendline resistance or downside pressures could return.
For a quick look into VeChain and VET, check out our coin guide here.
If you need a deeper analysis, look into our VeChain DARE.
Share this article
