
Bitcoin, Ethereum and XRP Stumble as ETC Leaps
The market appears slightly lethargic overall.
Trading is muted in crypto markets, especially with respect to Bitcoin. After measurable gain early on Monday, BTC mostly stayed around its new $10,500-10,700 level. The rest of the market is seeing considerable pullbacks, with almost all major coins posting losses.
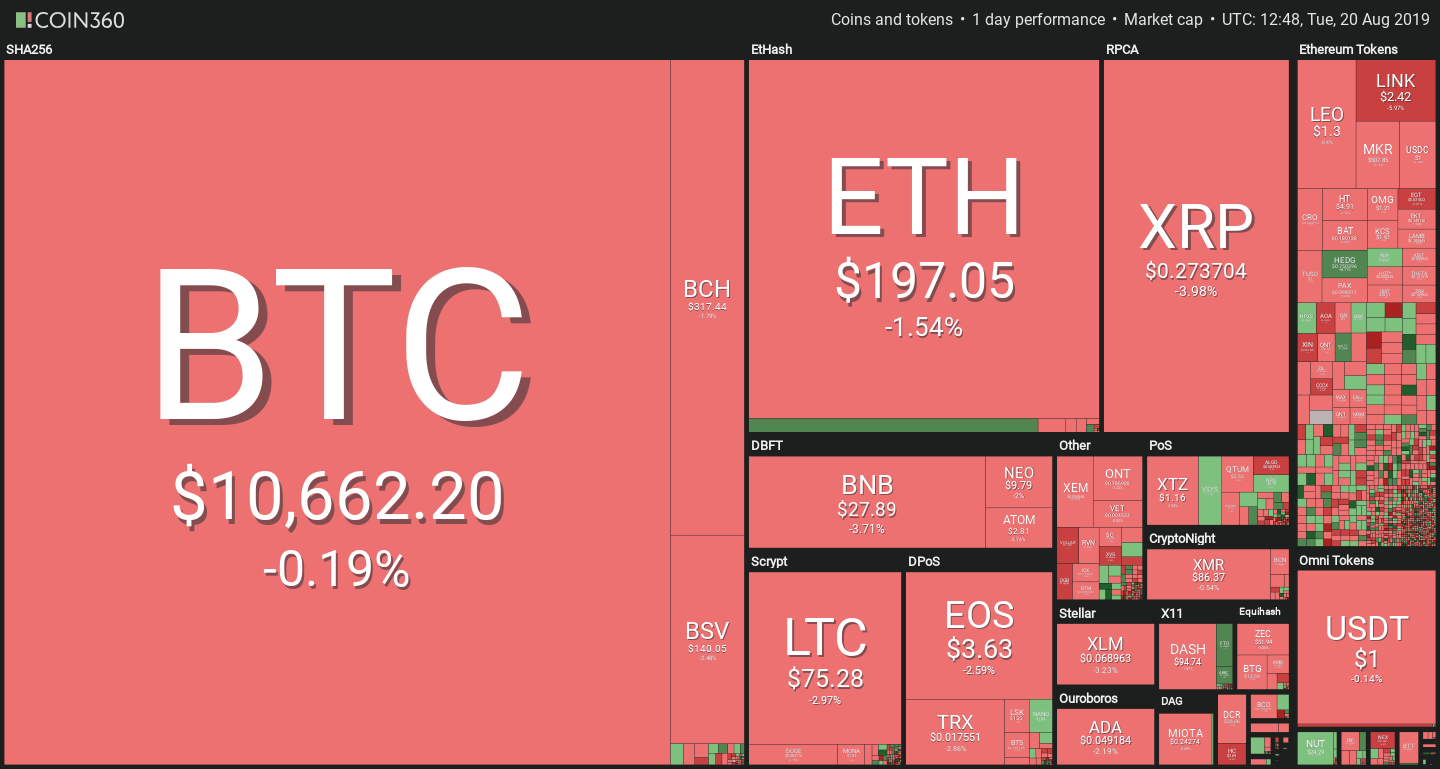
The most notable Bitcoin news on Monday was the apparent change of heart by the owner of the @Bitcoin account on Twitter, with 900,000 followers. The handle was previously known for favoring Bitcoin Cash.
Most of the recent tweets appear to have been deleted, with recent activity consisting of retweets discussing the change, as well as changing the page’s bio link to Bitcoin.org, instead of Roger Ver’s Bitcoin.com
I have no proof of this, but I think the owner of @bitcoin must have had a romantic relationship with Roger Ver and recently broke up with Roger. That's the only thing that can explain why @bitcoin stopped supporting BCH.
— Charlie Lee Ⓜ️🕸️ (@SatoshiLite) August 20, 2019
The altcoin landscape is more exciting: Ethereum began a powerful rally on Sunday, increasing by almost 10% over two days to reach a maximum of $202. A small correction from those levels was expected, with ETH falling a few points today.
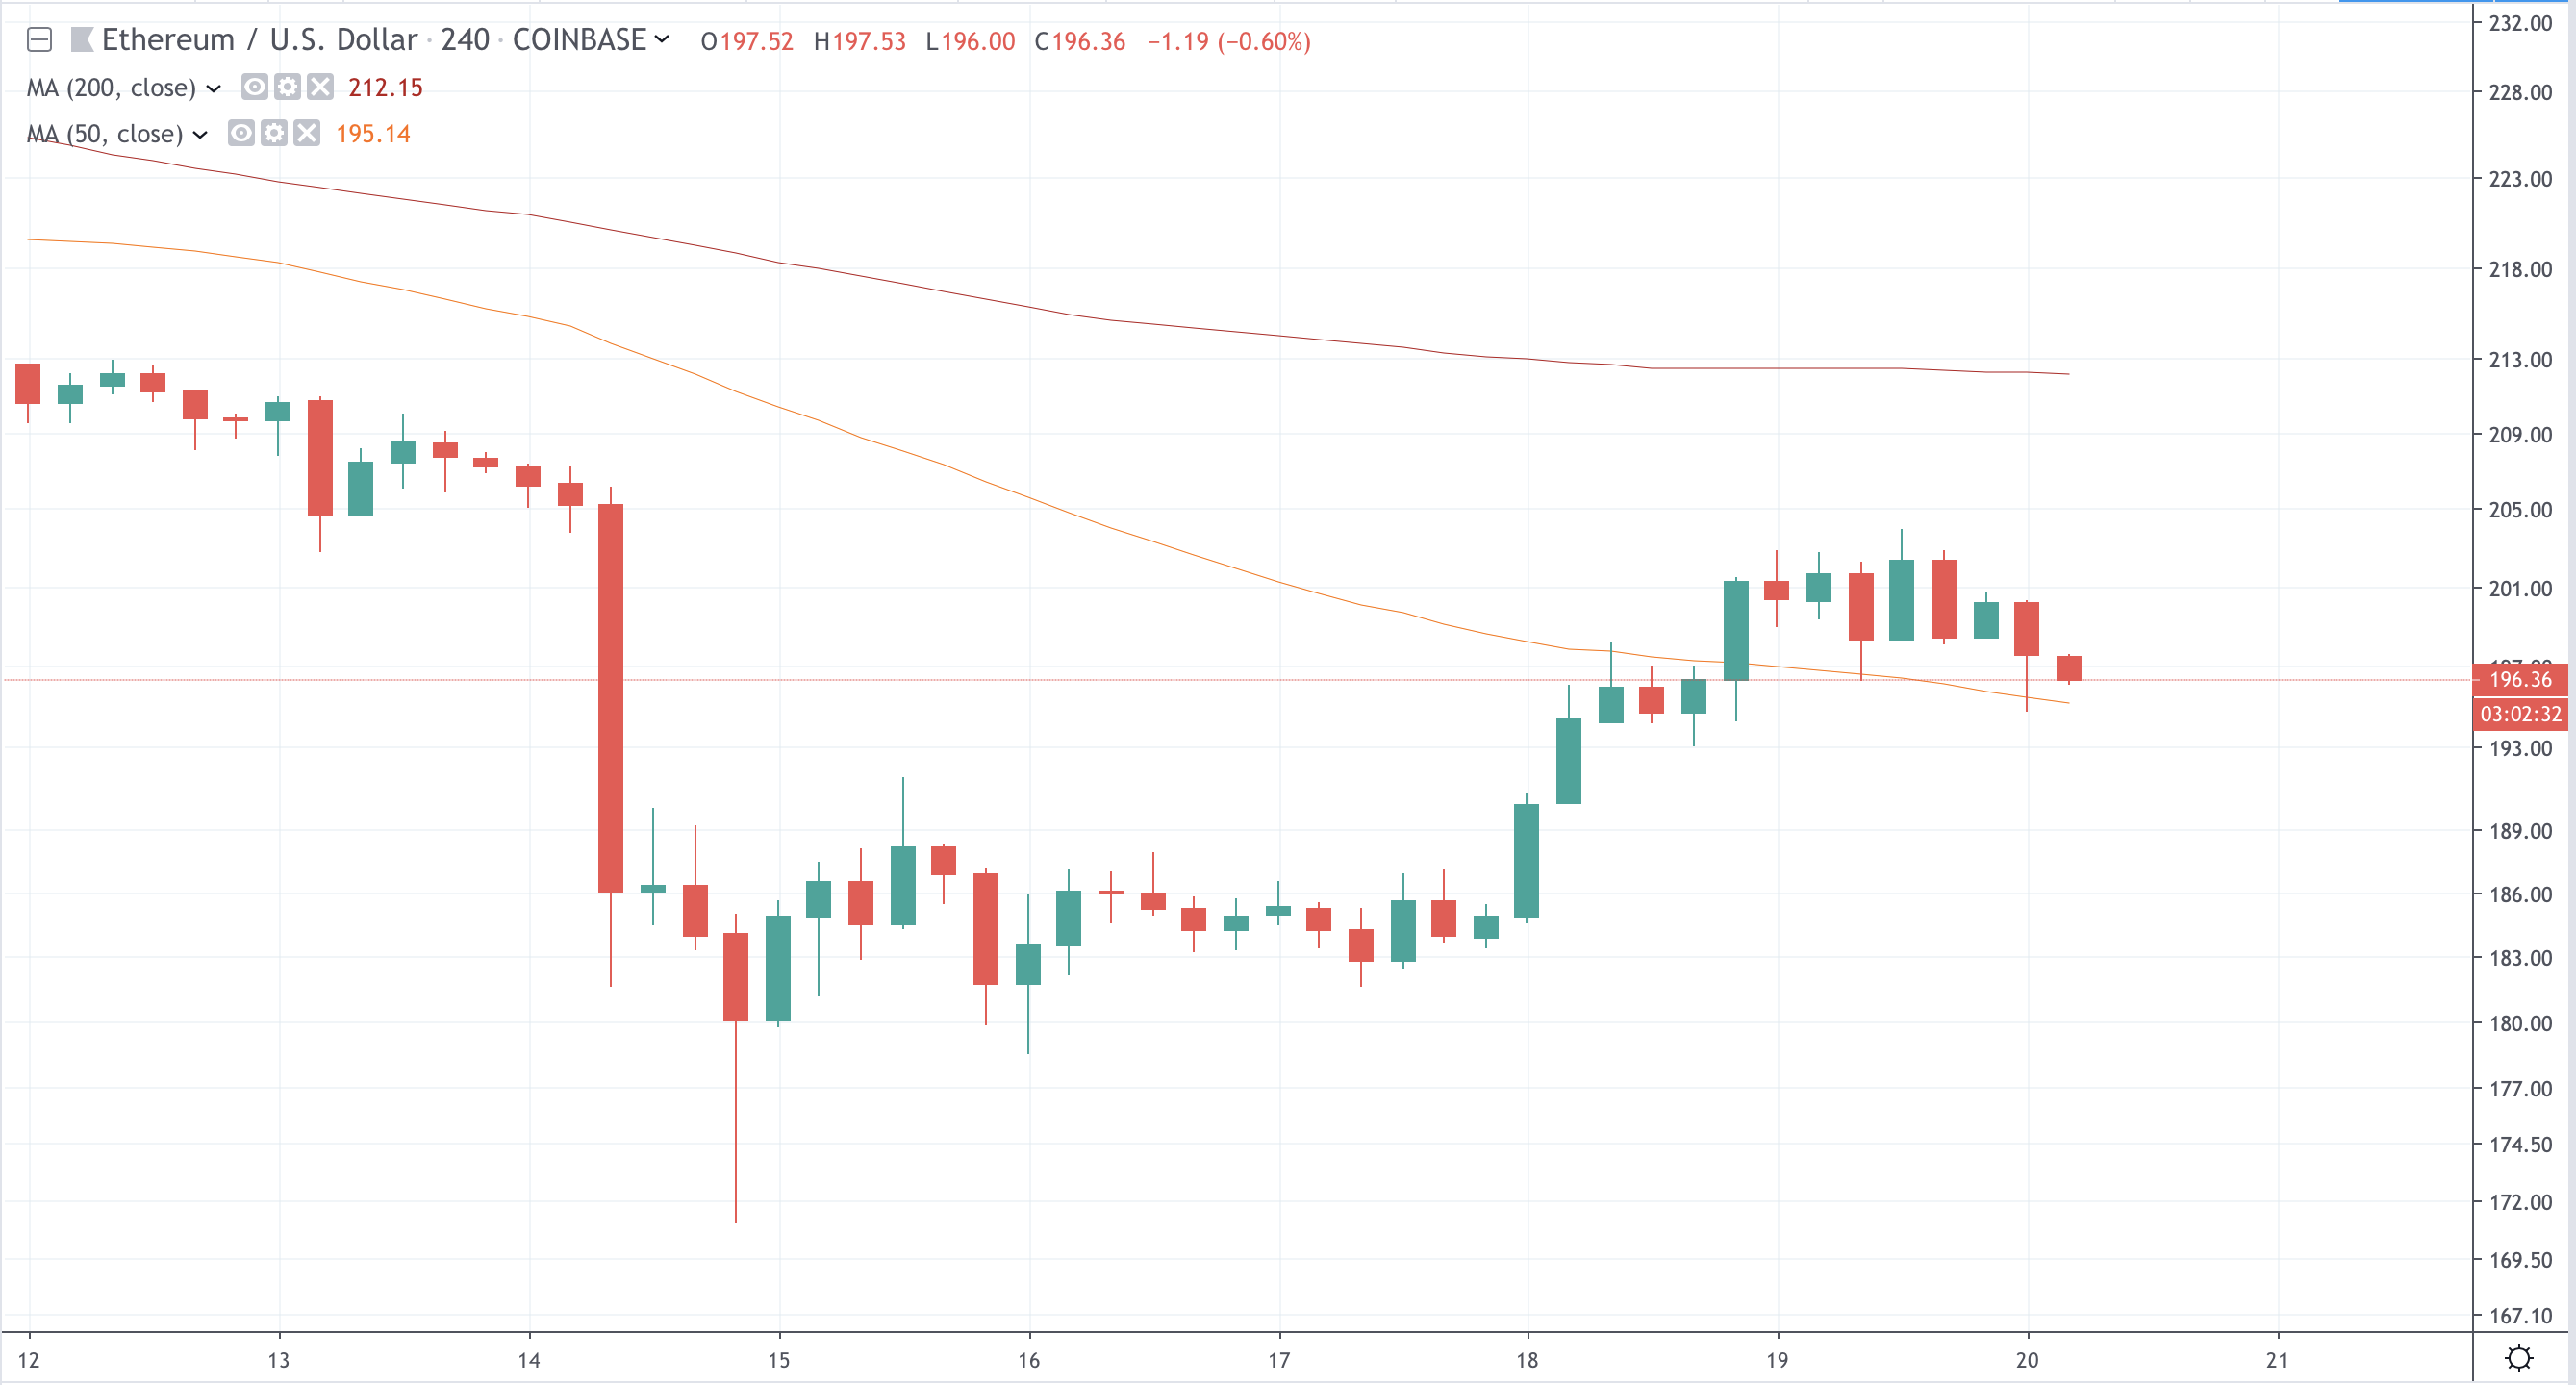
There has been no major news that would provide an immediate explanation, so the move is most likely of a technical nature. Vitalik Buterin did however give an interview to the Toronto Star, which was published yesterday. Due to the general nature of the publication, the interview was hardly ground-breaking: Vitalik discussed regulation, Ethereum use cases, while also emphasizing that Ethereum in its current state is not scalable. In other words, the interview was slightly bearish and clearly did not contribute to market movements.
ETH Technical Analysis of yesterday’s leg is available on Crypto Briefing.
XRP Rises On Ripple News
XRP made headlines yesterday for a news story with which it was almost totally unrelated: Santander, one of Spain’s leading banks, has pledged to implement the XRP-less xCurrent product created by Ripple Labs.
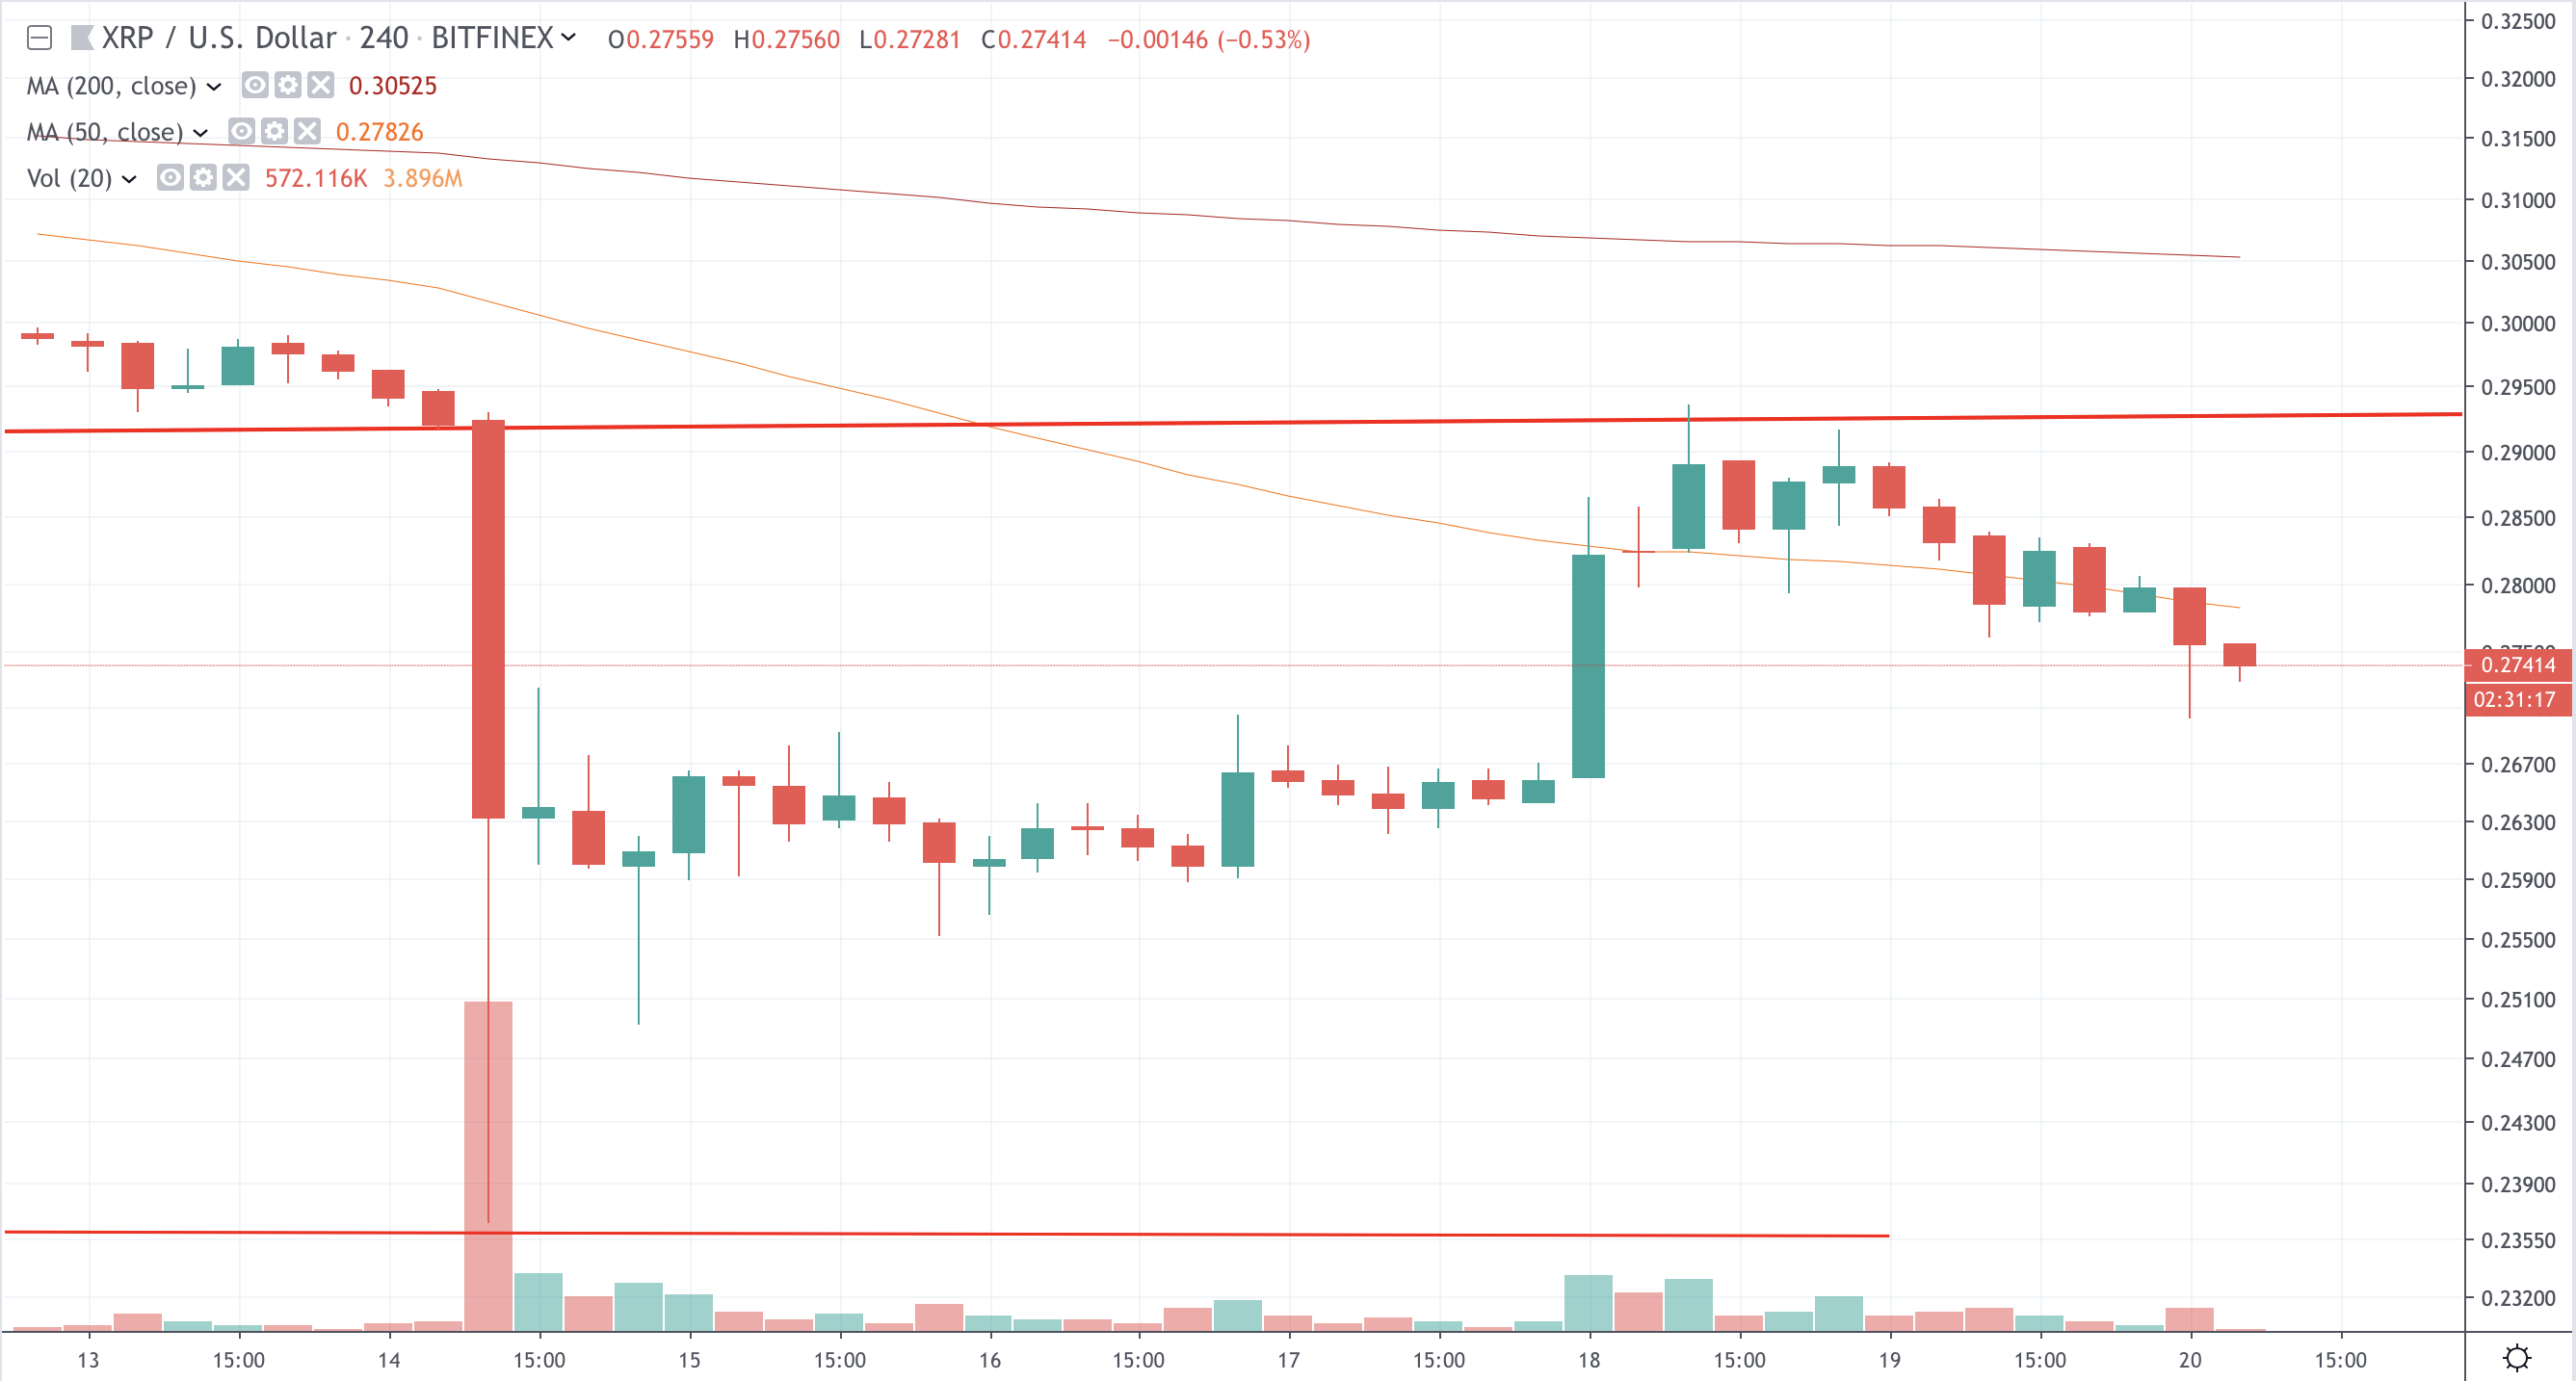
The market reaction was in the end quite tame: XRP briefly hit $0.29 soon after the news was published, a change that was within natural trading range. It has since fallen by about 7%, touching $0.27.
Ethereum Classic Scores A Rise
The only winner of Tuesday among the top-40 appears to be Ethereum Classic, which saw a rally tonight that pulled it from $5.51 to a maximum of $6.19, a 12% increase.
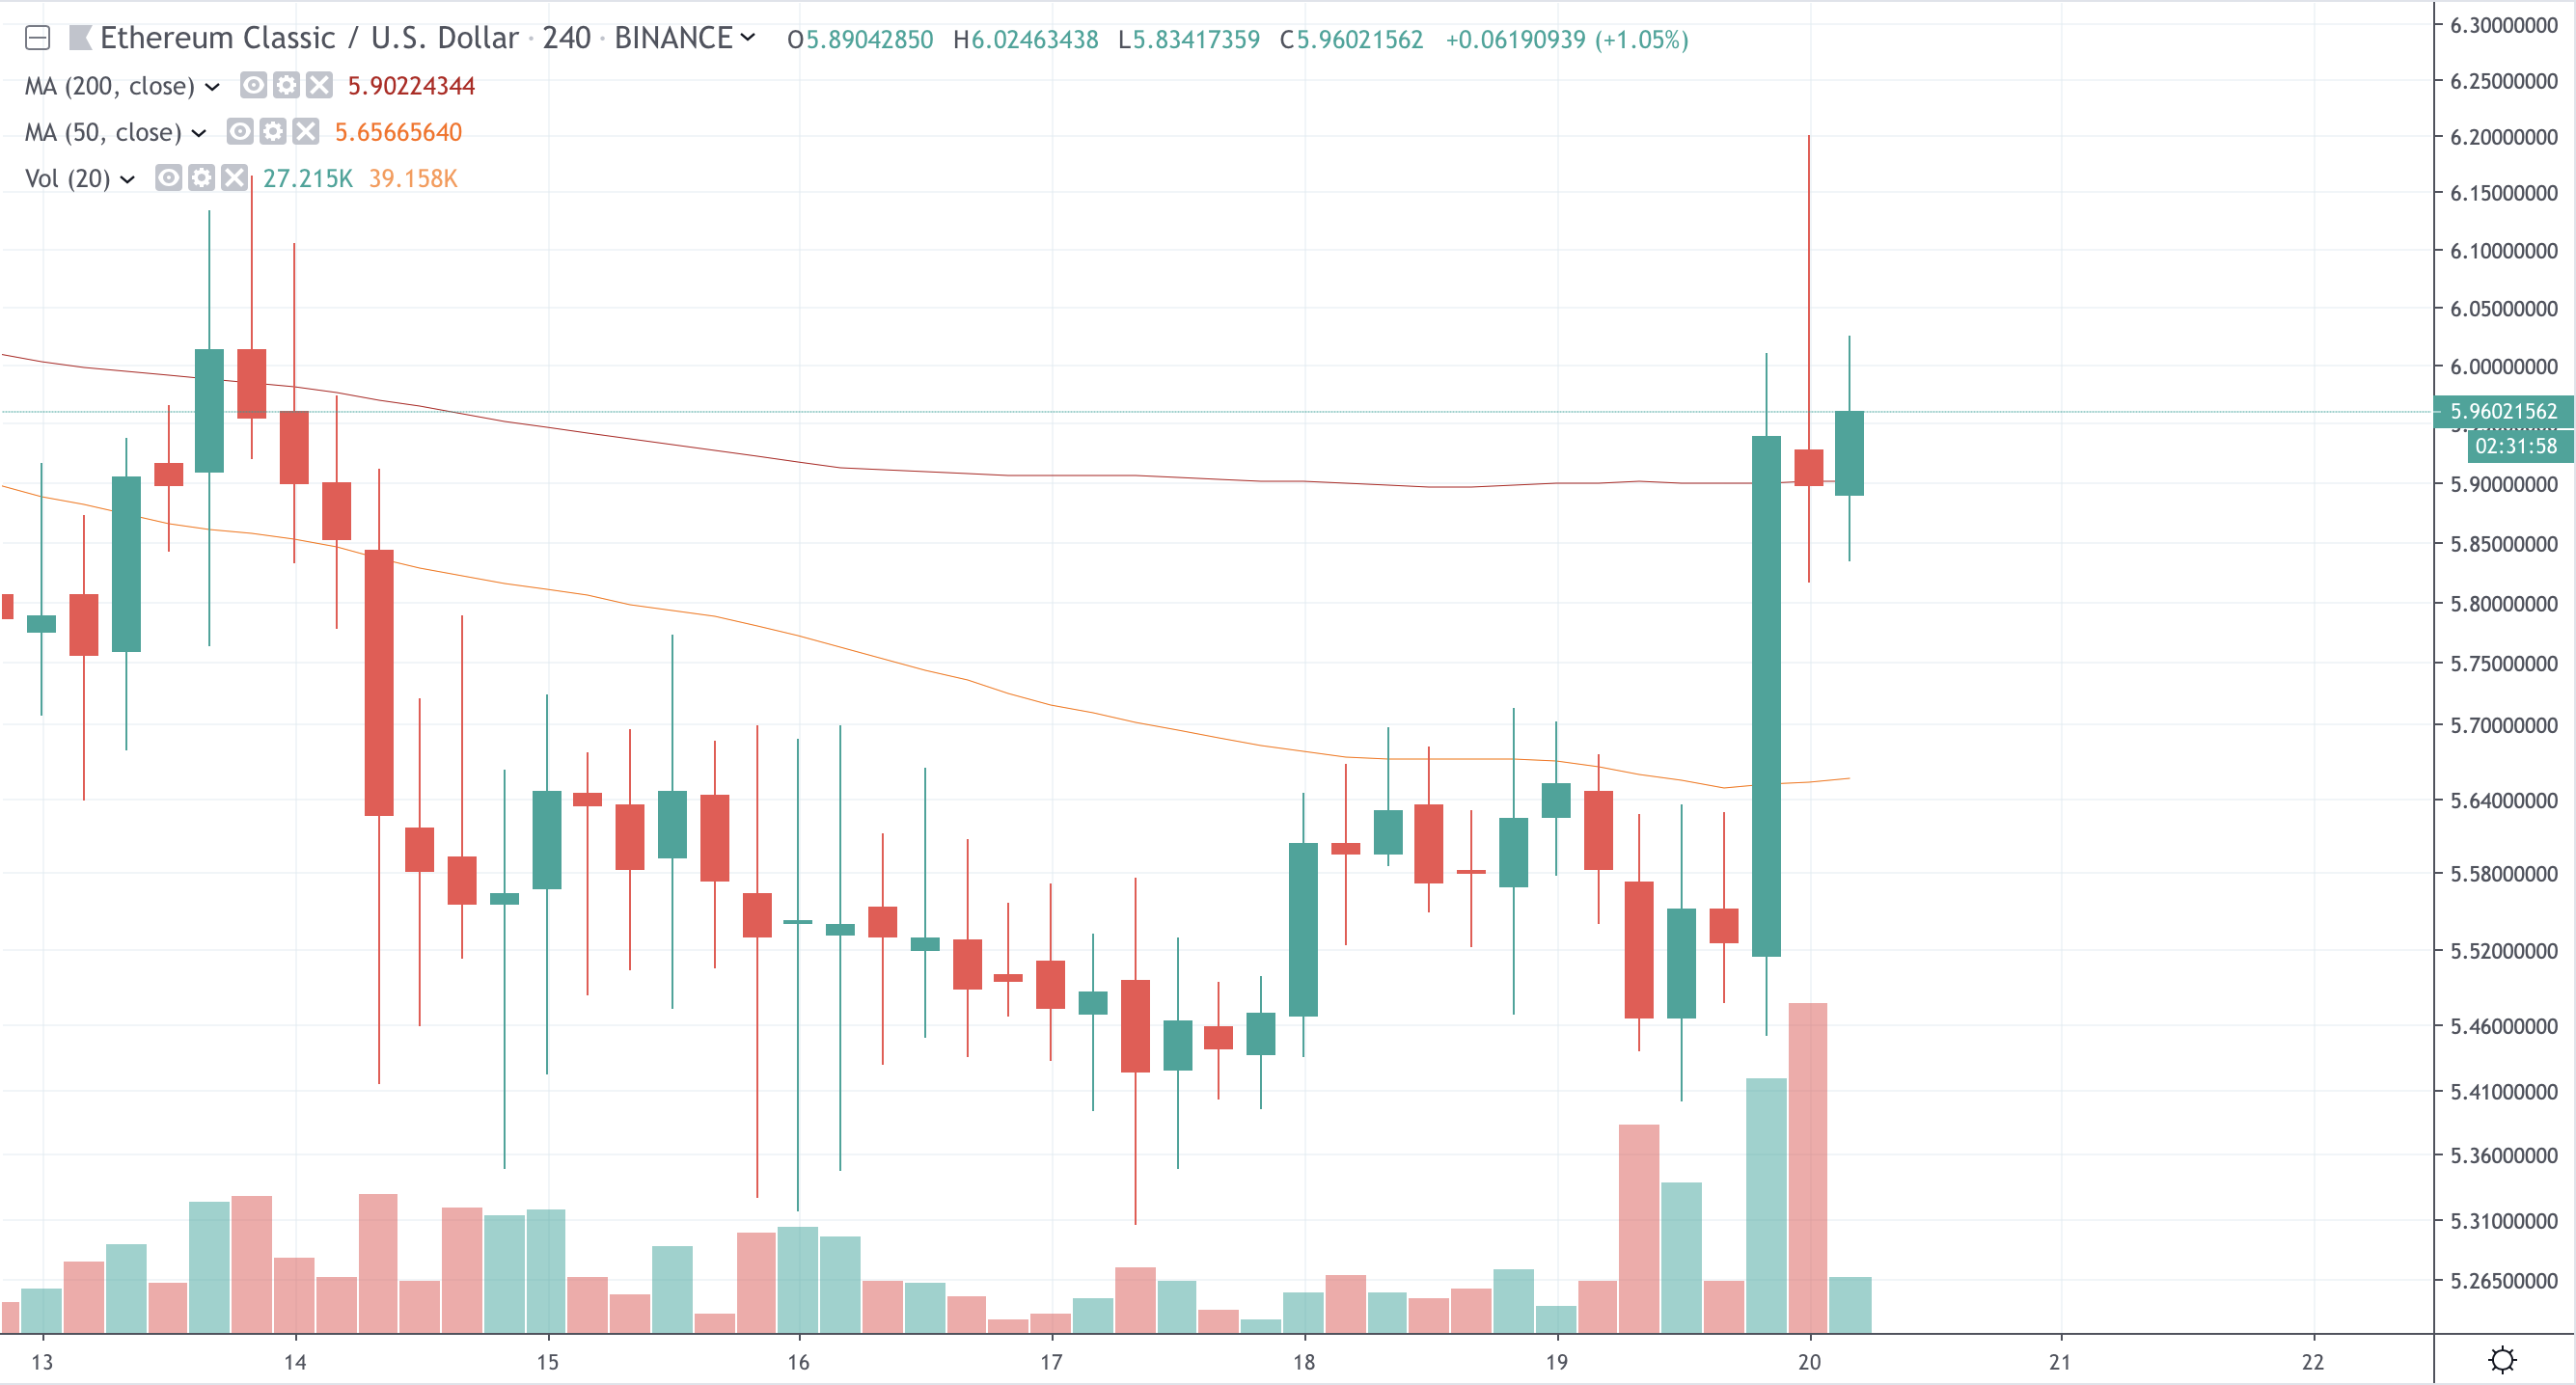
The only notable news that can be found about ETC is its participation in ETHBerlin on Thursday, the timing of which is unlikely to be related to the actual price increase. It seems likely that the movement was of a technical or insider nature, as there have been no fundamental catalysts to justify such a strong increase.
Technical Analysis: Nathan Batchelor on Bitcoin
Bitcoin has pulled back from its current weekly trading high of $10,975, after running into strong technical resistance from the top of the Ichimoku cloud on the four-hour time frame. I mentioned yesterday that Bitcoin could stage a much stronger technical rally if buyers broke above the Ichimoku cloud, so the $10,975 level is currently the level bulls need to break for further advancement this week.
Should we see Bitcoin start to lose bullish momentum around current trading levels and fail to break above Monday’s trading high, I expect that we will see a technical test back towards the $10,400 level support. However, if bulls breach the $10,975 level, we should then expect an immediate technical test of the $11,100 level.
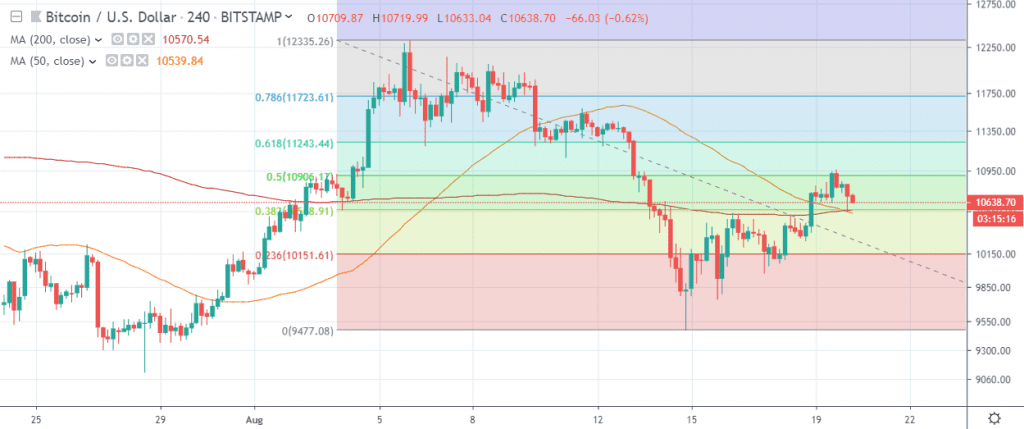
According to Fibonacci analysis, if we take a Fibonacci retracement from the August trading high to the current August trading low, the 50 percent Fibonacci retracement is located around the $10,900 level. With this in mind, the closest Fibonacci support level is the 38.2 percent retracement, at the $10,550, while the nearest Fibonacci resistance level above the current weekly high comes from the 61.8 percent retracement, at the $11,243 level.
*The trading action should take place around the $10,550 level today, watch for weakness or strength above this key area*
SENTIMENT
Intraday bullish sentiment for Bitcoin has improved to 50.53%, according to data from TheTIE.io – while the long-term sentiment indicator has increased, to 69.70% positive.
Bitcoin has been positively affected by the long-awaited Bakkt news. The platform should increase institutional interest towards the cryptocurrency, and its planned launch on Sep 23 is definitely a fundamentally bullish signal for all BTC investors.
Moreover, the next several months will be quite important for the overall industry. In October, SEC will have to make final decisions on two proposed Bitcoin ETFs. If approved, they would have an immense effect on the overall market.
UPSIDE POTENTIAL
As I noted on Monday, the upside potential for Bitcoin is likely to increase significantly if bulls can force price above the $11,100 level this week. To be more precise, we need to see a series of daily price closes above this key technical area to encourage the BTC/USD pair to move back towards the $11,600 to $11,700 level.
A bullish inverted head and shoulders pattern is currently in play while price trades above the $10,600 level, which suggests a possible move towards the $11,600 level. The bullish pattern will only be invalidated if we see the BTC/USD pair falling back under the $9,700 support level this week.
Key near-term technical resistance for the BTC/USD pair above the $11,100 level is located at the $11,243 and the $11,450 levels. Extended resistance is found at the $11,720 and $12,300 levels.
DOWNSIDE POTENTIAL
The downside for Bitcoin is likely to come into focus if we see sustained weakness below the $10,550 level. Moves back towards the $10,400 level should be expected if this scenario occurs, with the $10,380 and the $10,100 level the strongest support zones below.
It is also worth noting that in the short-term, both the 50-period moving average and the 200-period moving average are converging around the 38.2 percent Fibonnaci retracement of the August monthly high to the August monthly low, at $10,550.
This article has been updated with additional analysis.