
Market Commentary: Short-Term Shake Out As Bakkt Suffers
Long-term belief remains relatively strong.
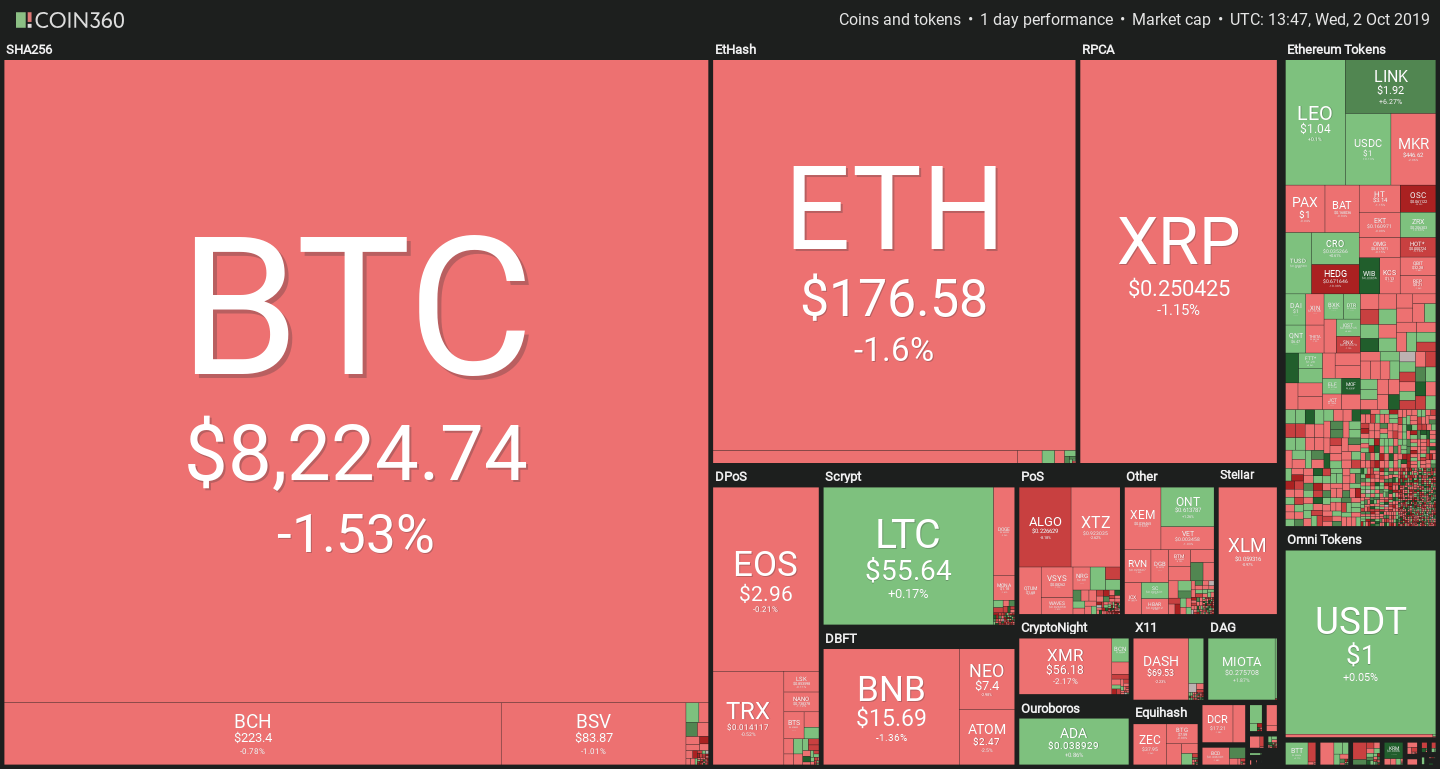
Bitcoin prices are continuing to fluctuate. Despite a promising start, BTC lost the majority of its gains yesterday. Other leading coins are essentially following Bitcoin, with Chainlink’s +5% as the only voice outside the choir.
Weak hands shaken out?
A report published by Coinmetrics provided valuable insight into the late-September fall. Analyzing the metric of ‘realized capitalization‘, which assigns value to bitcoins according to their last on-chain movement, Coinmetrics was able to pinpoint which cohort of Bitcoin holders participated the most in the recent sell-off.
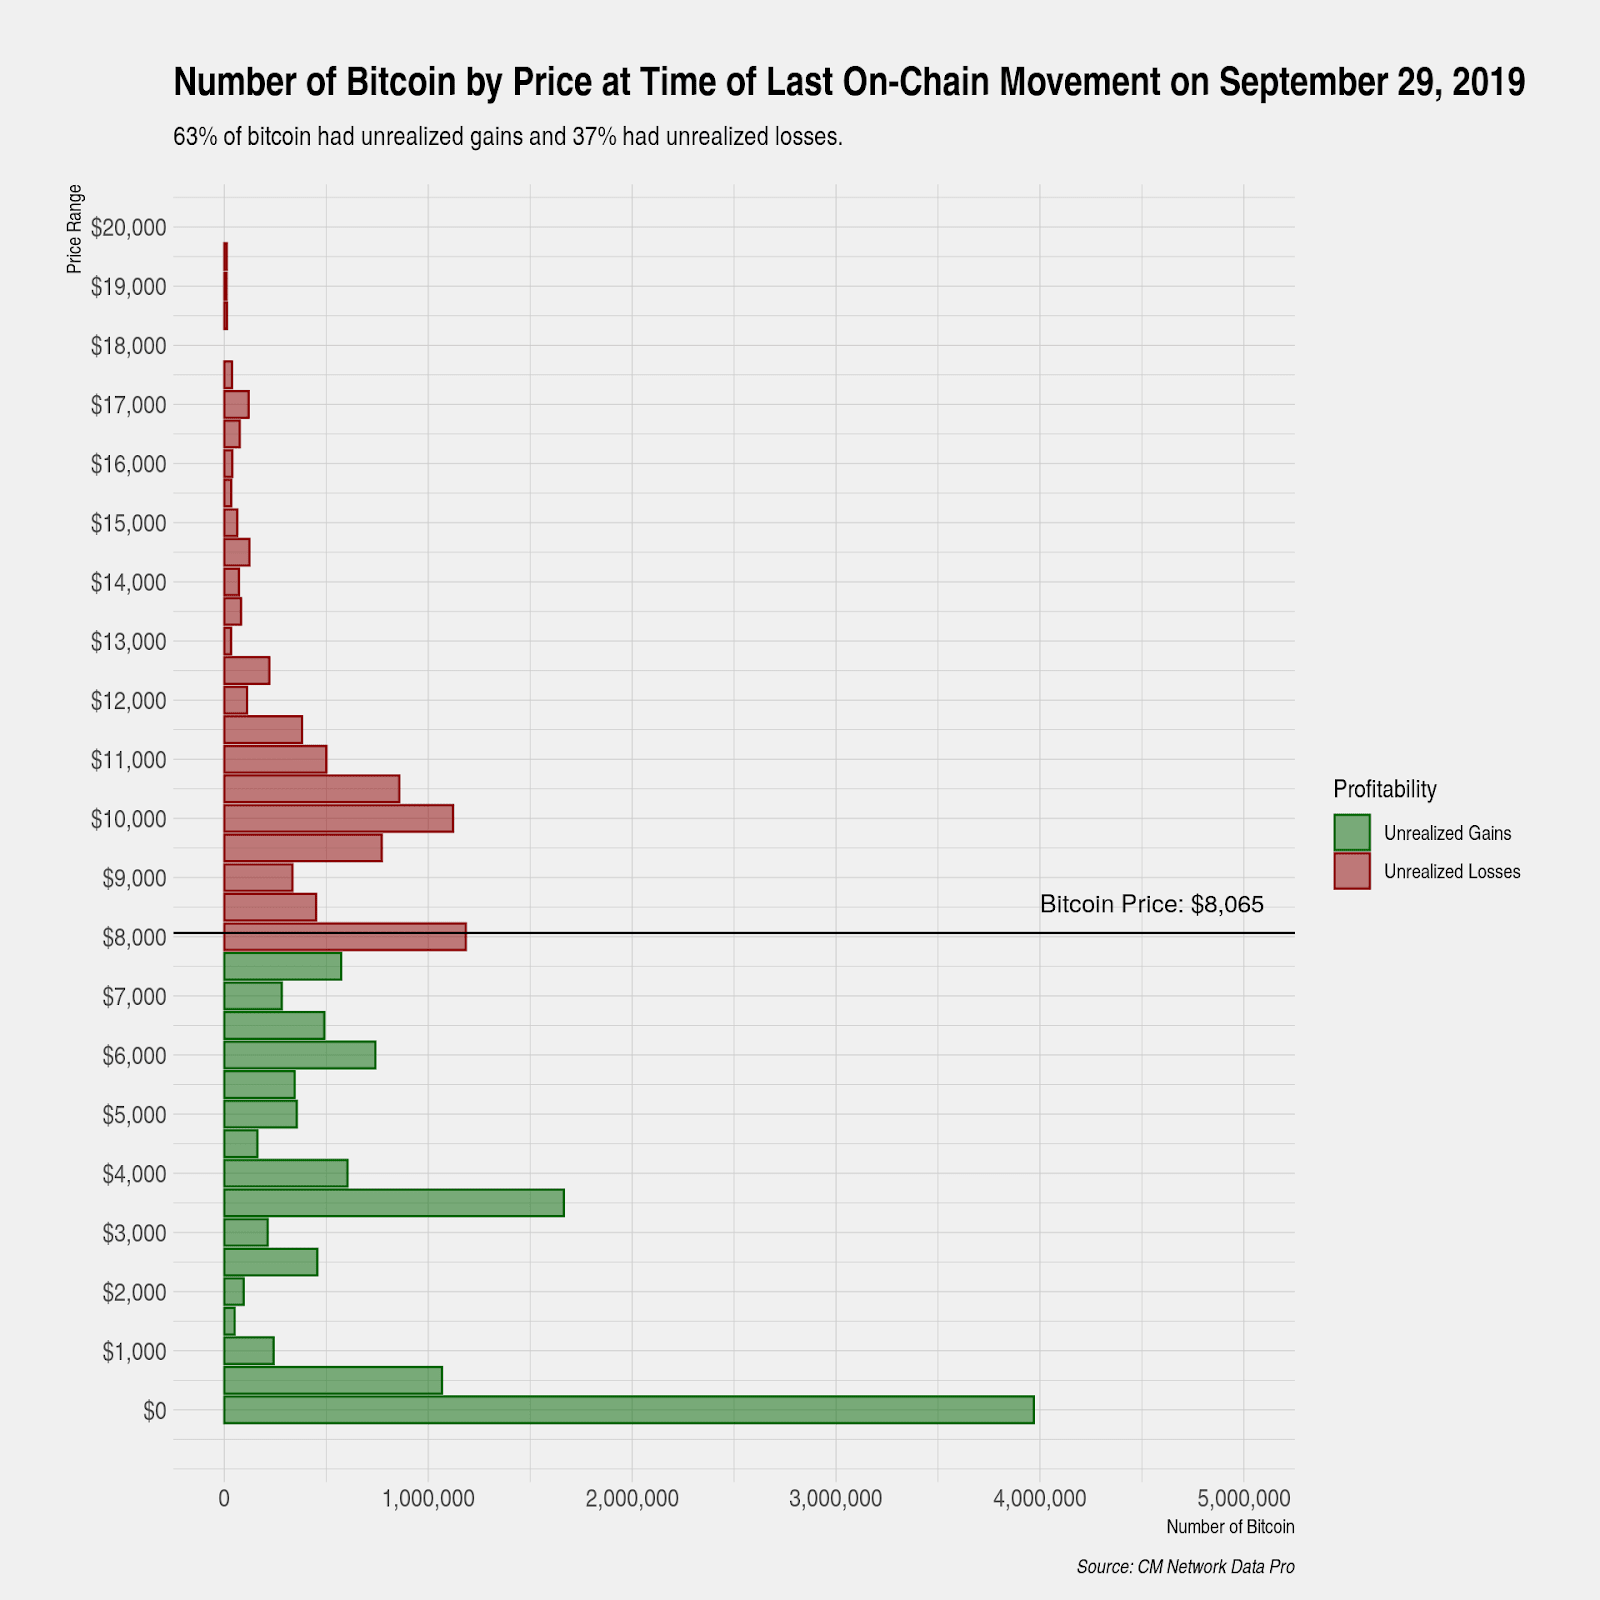
As evidenced by the graph above, the majority of bitcoins have been acquired at lower values than current price. Capitulation among the participants in the 2017 bull run is nearly complete, with very few bitcoins left that were bought for more than $13,000.
A strong peak around the $3,000-4,000 level seems to show that many people correctly called the bottom in 2018, and few of them sold so far. Some of these could include early birds from 2017 as well, though given how much time passed, they’re likely to be only a small percentage.
Coinmetrics notes that the majority of recent selling came from those who bought at the June-July peaks, between $10,000 and $12,000. These traders were most likely geared towards the short term, and as it became clear that their positions would not break even, they moved to cut their losses en masse.
But the overall bullish sentiment seems to not be changing among those who entered the market at lower prices. “These owners represent long-term holders with a strong long-term conviction in Bitcoin. Approximately 11.46 million Bitcoin belong to this cohort,” reported Coinmetrics. “Despite the extreme market movement, these holders have remained resolute in their market views — only 150,000 of the 11.46 million Bitcoin were seen to have moved on-chain.”
Derivatives amplified the strength of the fall
Bakkt continues to disappoint
While the slow start of Bakkt was likely just a spark hitting a rigged gunpowder keg, the anticipation that was built around it cannot be shrugged off as inconsequential.
According to data from Bakkt Bitcoin Bot on Twitter, the platform’s performance is hitting new lows.
https://twitter.com/BakktBot/status/1179318434640924672
A sharp fall in total traded volume yesterday does not bode well for the platform’s immediate future. At the same time, any new product launch is necessarily going to have hiccups, especially as recent events turned away many short-term speculators. The platform still represents an important step in wider adoption, which may greatly help the market in more favorable times.
Bitcoin Commentary By Nathan Batchelor
Bitcoin failed to hold onto promising upside gains on Tuesday, placing the number one cryptocurrency back under its 200-day moving average for a seventh consecutive day.
My recent analysis highlighted the $6,600 and $4,700 levels as possible bearish targets if the recent decline in the BTC / USD pair resumes.
Today I would like to look at the Ichimoku indicator on the weekly time frame for further confirmation of the potential upcoming bearish targets and also for a long-term technical overview of the BTC / USD pair.
The Ichimoku indicator shows that the BTC / USD pair is still trading above the Ichimoku cloud on the weekly time frame, which should certainly be taken as a long-term positive.
Bitcoin first broke back above the weekly Ichimoku cloud in June, after languishing below the cloud for over one year. The top of the cloud is currently located around the $6,600 level, which is a key technical area.
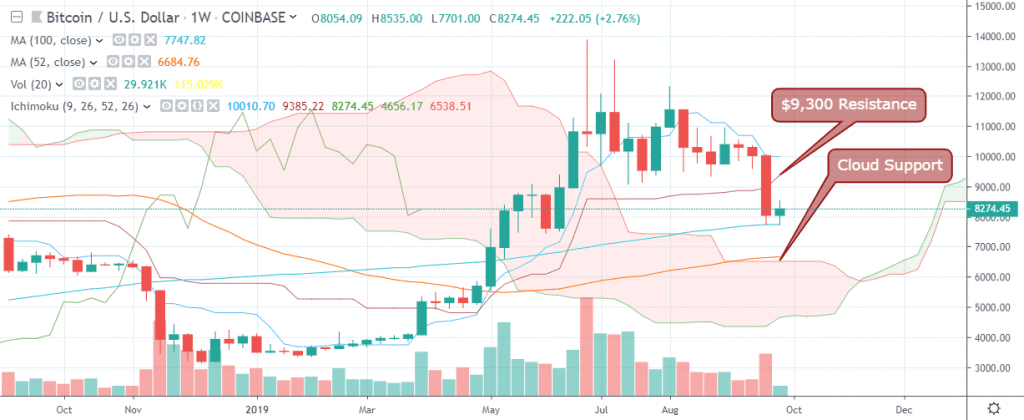
Furthermore, the bottom of the weekly Ichimoku cloud is located around the $4,700 level, which is also the BTC / USD pair’s 200-week moving average and a major long-term support of increasing technical importance.
If an upside recovery does take place, the Ichimoku indicator is highlighting the $8,500 level as future resistance, with the $9,300 and $10,000 levels acting as the major upside resistance level.
In summary, a drop under the $7,700 level could provoke sellers to test towards the weekly Ichimoku cloud, around the $6,600 level, while a move above the $8,500 level could inspire bulls to test towards the $9,300 level.
A rally towards the $10,000 level will invalidate the recent bearish move and place Bitcoin in a much more advantageous position over the medium-term, with the $15,000 level as the likely upside objective.
*Various forms of analysis are confirming the $6,600 level as a likely target if the $7,700 level is broken.*
SENTIMENT
Intraday bullish sentiment for Bitcoin has improved, to 42.00%, according to the latest data from TheTIE.io. Long-term sentiment for the cryptocurrency has moved lower, to 63.00%, but still remains positive.
UPSIDE POTENTIAL
The $8,500 level is now key intraday technical resistance if bulls can gather strength above the BTC / USD pair’s 200-day moving average. Above the $8,500 level, the $9,000 to $9,100 levels are absolutely key.
Longer-term analysis strongly suggests that a rally towards the $10,000 level will take place if BTC / USD bulls can break through the $9,300 resistance area.
DOWNSIDE POTENTIAL
The BTC / USD pair’s 100-week moving average is currently the strongest form of technical support if price starts to trade below the $8,000 level.
If the cryptocurrency breaks below the $7,700 level, the $7,500 and $7,100 levels offer the only forms of notable technical support prior to the $6,600 level.
A full version of Nathan Batchelor’s Daily Bitcoin Commentary, together with his calls, is available to SIMETRI Research subscribers earlier in the day.