VeChain Price Analysis VET / USD: Three Days Of Gains
VeChain bulls are in the driver's seat following positive announcements.

Share this article
- VeChain has a bullish short-term trading bias, with the cryptocurrency trading above its 200-period moving average on the four-hour time frame
- The VET / USD pair continues to trade close to the best levels of 2019 so far
- The daily time frame is showing that the recent bullish breakout has reached its upside target
VeChain / USD Short-term price analysis
VeChain has a bullish short-term bias, with the cryptocurrency holding above its 200-period moving average on the four-hour time frame.
The four-hour time frame is showing that a head and shoulders pattern has formed, with the VET / USD pair currently carving out a right-hand shoulder to complete the bearish pattern.
Technical indicators on the four-hour time frame have turned bullish and continue to generate buy signals.
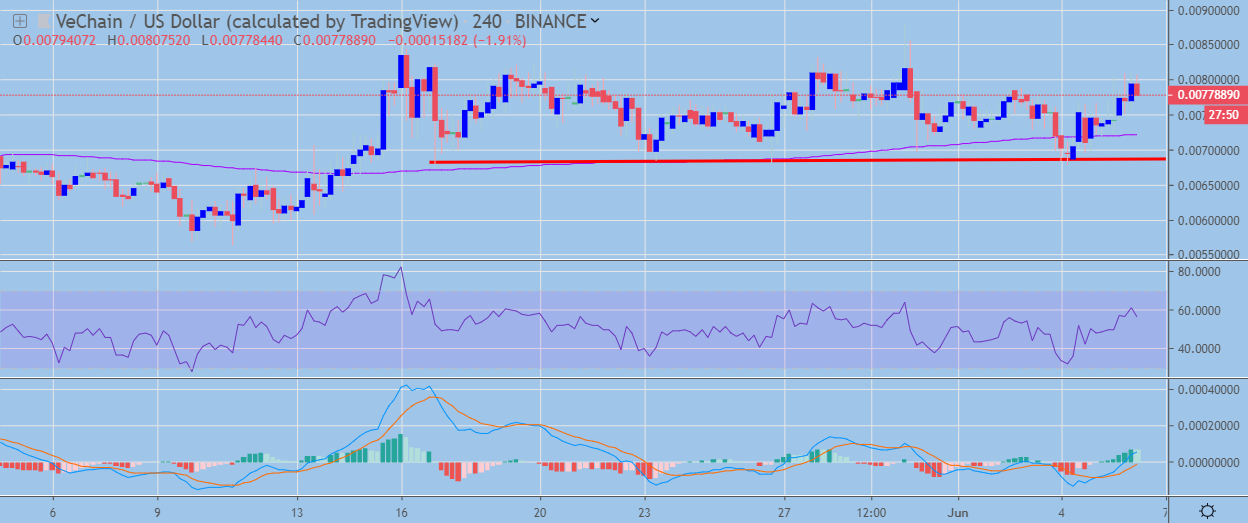 VET / USD H4 Chart by TradingView
Pattern Watch
Traders should note that the VET / USD pair will fall towards the May 2019 trading low if the head and shoulders pattern is triggered.
Relative Strength Index
The RSI indicator on the four-hour time frame has turned bullish and continues to show scope for further upside.
MACD Indicator
The MACD indicator on the four-hour time frame is currently bullish, with the MACD signal line issuing a buy signal.
Fundamental Analysis
VeChain has gained bullish momentum after several recent announcements. The project has successfully launched a supply chain application, which tracks the supply of milk by Chinese-based Bright Food. In addition to that, the VET token has been listed in the crypto.com wallet and VISA card, which should support its liquidity.
VeChain / USD Medium-term price analysis
VeChain has a bullish medium-term trading outlook, with the VET / USD pair still trading well above its trend defining 200-day moving average.
The daily time frame is showing that the bullish inverted head and shoulders and falling wedge pattern breakouts have now reached their upside projection.
Technical indicators on the daily time frame are mixed and are currently failing to issue a clear trading signal.
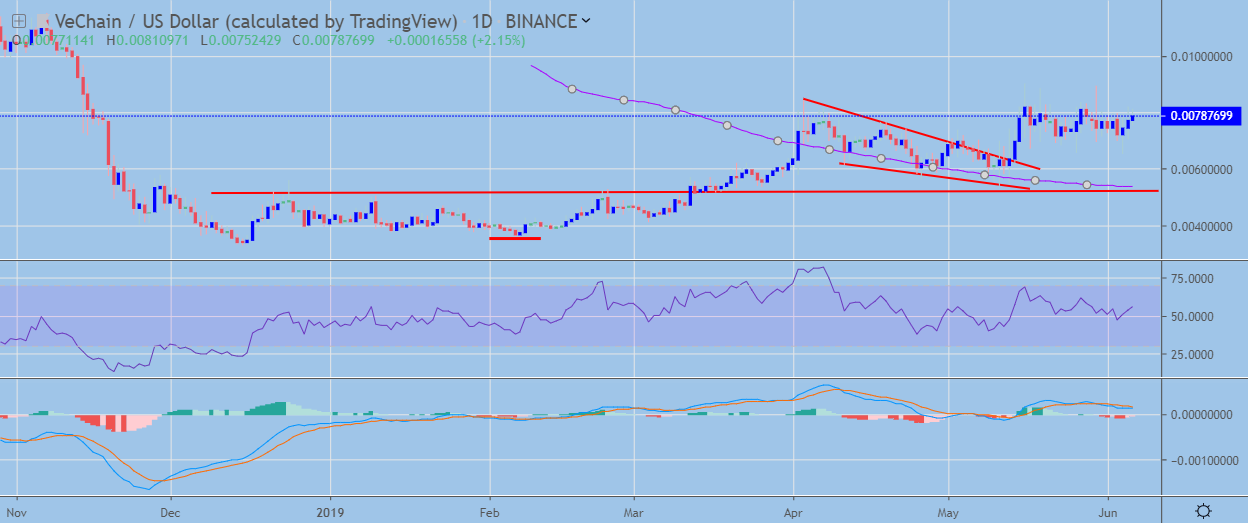 VET / USD Daily Chart by TradingView
Pattern Watch
Traders should note that the neckline of the large inverted head and shoulders pattern is now acting as a major technical support alongside the VET / USD pair’s 200-day moving average.
Relative Strength Index
The RSI indicator on the daily time frame is bullish and shows scope for further upside.
MACD Indicator
The MACD indicator is neutral on the daily time frame, with the MACD indicator failing to generate a clear trading signal.
Conclusion
VeChain is attempting to post its third straight day of trading gains as bulls attempt to regain upside momentum following the recent reversal from the VET / USD pair’s all-time trading high.
Buyers now need to invalidate the bearish pattern on the four-hour time frame or the cryptocurrency could start to fall back towards 200-day moving average.
For a quick look into VeChain and VET, check out our coin guide here.
If you need a deeper analysis, look into our VeChain DARE.
Share this article
