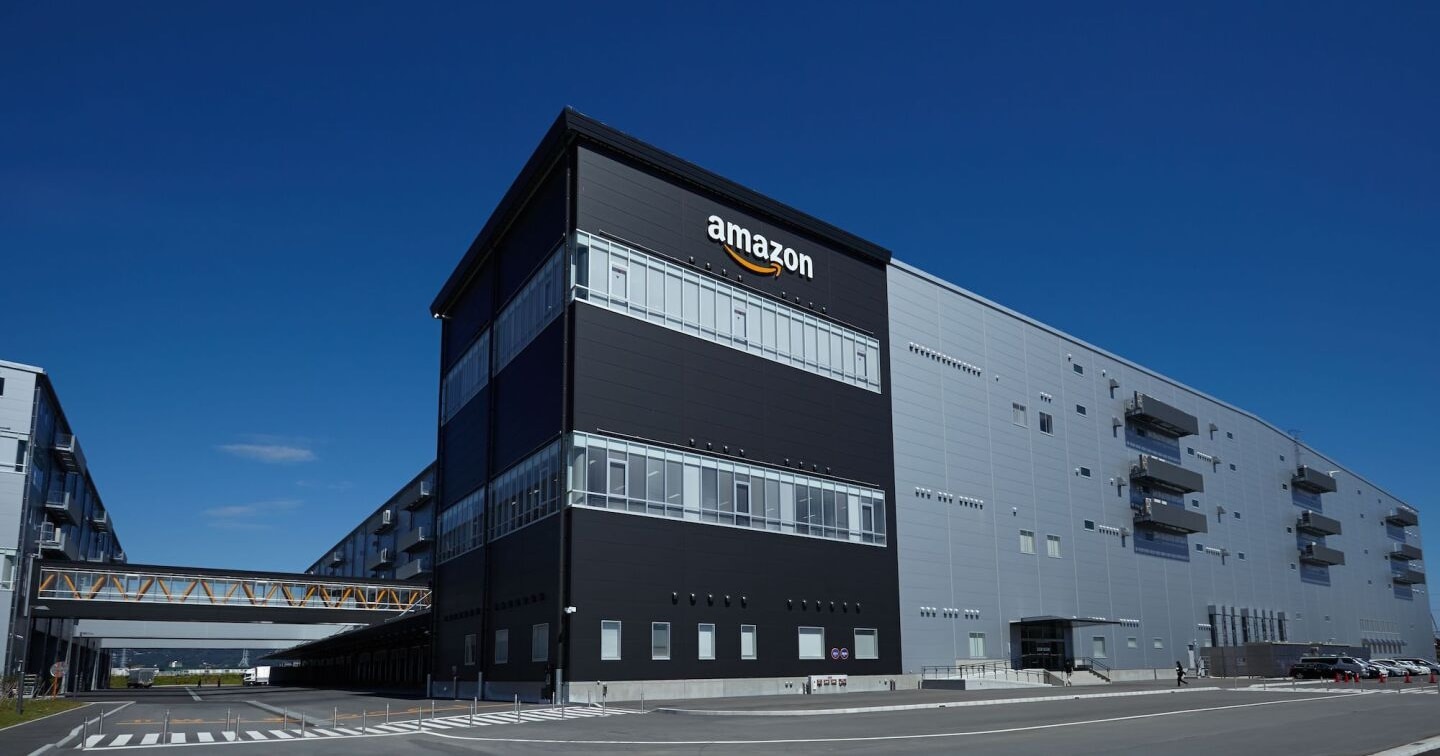
Amazon and Microsoft are cutting deals with small towns to keep their data center empire growing
Tech giants are negotiating community benefit agreements worth billions as AI-driven energy demand reshapes local power grids and raises costs for consumers.
+12.4% (FY ended 2025-12-31 vs FY ended 2024-12-31) 10-K
Annual net income
77,670,000,000 USD (FY ended 2025-12-31, attributable to the company) 10-K
Annual operating margin
11.2% (FY ended 2025-12-31)
Forward P/E
Unavailable: no dated forecast source
Gloria daily close for session Oct 27, 2026. Market cap and trailing P/E use this close with the SEC share total and trailing diluted earnings, each dated next to its figure. Annual revenue, revenue growth, net income and margin show their own fiscal period and link the 10-K. Current context may postdate this article.
Amazon.com Inc. and its peers
Company
Price
Market cap
P/E (trailing)
Forward P/E
Annual revenue (USD)
Annual revenue growth
Annual net income (USD)
Operating margin
Amazon.com Inc.
AMZN · Price dated Oct 27, 2026 · tokenized AMZNx
21,893,000,000FY ended 2026-01-31, attributable to the company · 10-K
4.2%FY ended 2026-01-31
Missing figures stay unavailable. Forward P/E requires a dated source. Annual revenue, revenue growth, net income and margin come from each company's own 10-K, in US dollars, and each row shows that fiscal year. Revenue growth compares the fiscal year with the prior year stated in the same 10-K. Net income is the full year amount attributable to the company, or available to common stockholders where the filing states only that, or consolidated net income. Each row names its basis. Trailing P/E reads "Not meaningful" when the dated trailing diluted EPS is a loss or zero. An operating margin appears only when the filing states both the operating income and the revenue for the same year.
Sources: SEC filings, Gloria daily closes and CoinGecko. Oldest record refresh: Oct 27, 2026, 7:41 PM EDT. Refresh is not a price or filing date. Each row shows its price date and its annual fiscal period. Peers use industry code and company size, or editorial selection. Market cap multiplies that row price by the company share total the latest SEC filing states for every share class together. Trailing P/E divides it by trailing diluted earnings from SEC filings. Rolled earnings per share are approximate because share counts can change between periods. Both appear only when the SEC data carries its date, so they are estimates at one price date, not synchronized filing valuations. Not investment advice.
Token vs underlying stock
Current comparison for AMZN. Historical observations may postdate this article.
Split-adjusted regular-session stock closes from the existing Gloria shared history, paired only with an observed token price within 45 minutes of 16:00 New York time. Up to 60 matched sessions. No interpolation or missing-date fill. Weekends and known early closes are omitted. Token units are not adjusted for issuer multipliers or dividend treatment. This compares quoted prices, not fair value, executable premiums or arbitrage returns. Solid line: token. Dashed line: stock. Exact quote times and values appear below. Historical observations. Retrieval refers to the token source. Token quote times use UTC. The fixed cohort shows its oldest member fetch.
Amazon token vs Amazon stock: exact source values
Date (UTC)
Token (USD)
Stock close (USD)
Token quote (UTC)
2026-08-04
277.39
277.42
2026-08-04 20:00
2026-08-05
272.84
272.65
2026-08-05 20:00
2026-08-06
272.13
272.26
2026-08-06 20:00
2026-08-07
274.76
274.48
2026-08-07 20:00
2026-08-10
277.96
278.09
2026-08-10 20:00
2026-08-11
272.21
272.27
2026-08-11 20:00
2026-08-12
267.48
267.28
2026-08-12 20:00
2026-08-13
265.07
265.13
2026-08-13 20:00
2026-08-14
262.81
262.65
2026-08-14 20:00
2026-08-17
261.07
261.31
2026-08-17 20:00
2026-08-18
259.40
259.45
2026-08-18 20:00
2026-08-19
265.80
265.84
2026-08-19 20:00
2026-08-20
259.95
260.11
2026-08-20 20:00
2026-08-21
258.73
258.63
2026-08-21 20:00
2026-08-24
262.28
262.07
2026-08-24 20:00
2026-08-25
261.06
261.06
2026-08-25 20:00
2026-08-26
260.32
260.28
2026-08-26 20:00
2026-08-27
256.30
256.26
2026-08-27 20:00
2026-08-28
266.44
266.43
2026-08-28 20:00
2026-08-31
259.63
259.77
2026-08-31 20:00
2026-09-01
254.64
254.92
2026-09-01 20:00
2026-09-02
254.81
254.98
2026-09-02 20:00
2026-09-03
258.83
258.90
2026-09-03 20:00
2026-09-04
258.34
258.51
2026-09-04 20:00
2026-09-08
256.81
256.97
2026-09-08 20:00
2026-09-09
252.24
252.40
2026-09-09 20:00
2026-09-10
251.61
251.89
2026-09-10 20:00
2026-09-11
257.13
256.78
2026-09-11 20:00
2026-09-14
253.68
253.54
2026-09-14 20:00
2026-09-15
248.35
248.42
2026-09-15 20:00
2026-09-16
246.01
245.96
2026-09-16 20:00
2026-09-17
251.35
251.19
2026-09-17 20:00
2026-09-18
253.69
253.71
2026-09-18 20:00
2026-09-21
258.31
258.45
2026-09-21 20:00
2026-09-22
255.06
254.98
2026-09-22 20:00
2026-09-23
249.39
249.27
2026-09-23 20:00
2026-09-24
249.48
249.38
2026-09-24 20:00
2026-09-25
249.71
249.67
2026-09-25 20:00
2026-09-28
246.30
246.15
2026-09-28 20:00
2026-09-29
246.66
246.67
2026-09-29 20:00
2026-09-30
249.53
249.15
2026-09-30 20:00
2026-10-01
248.17
248.23
2026-10-01 20:00
2026-10-02
251.37
251.52
2026-10-02 20:00
2026-10-05
251.43
251.40
2026-10-05 20:00
2026-10-06
256.28
256.29
2026-10-06 20:00
2026-10-07
259.85
259.92
2026-10-07 20:00
2026-10-08
254.31
254.06
2026-10-08 20:00
2026-10-09
262.35
262.43
2026-10-09 20:00
2026-10-12
259.60
259.53
2026-10-12 20:00
2026-10-13
258.72
258.58
2026-10-13 20:00
2026-10-14
253.89
254.08
2026-10-14 20:00
2026-10-15
254.89
254.76
2026-10-15 20:00
2026-10-16
250.16
250.00
2026-10-16 20:00
2026-10-19
262.52
262.45
2026-10-19 20:00
2026-10-20
262.57
262.63
2026-10-20 20:00
2026-10-21
262.57
262.37
2026-10-21 20:00
2026-10-22
250.30
250.38
2026-10-22 20:00
2026-10-23
248.07
248.00
2026-10-23 20:00
2026-10-26
248.95
249.09
2026-10-26 20:00
2026-10-27
253.41
253.10
2026-10-27 20:00
Stock history: Gloria · Retrieved Oct 28, 00:31 UTC. Token history: CoinGecko AMZNx.
Quoted token and share units can have different rights, multipliers and dividend treatment. This is not an executable premium or arbitrage signal.
The biggest infrastructure buildout in a generation isn’t being negotiated in corporate headquarters. It’s happening in town council meetings across the Midwest, where Amazon and Microsoft are sitting down with local officials to hammer out deals that promise jobs, tax revenue, and renewable energy in exchange for something increasingly precious: permission to consume enormous amounts of electricity.
The new community contract
Microsoft fired the first formal shot in January 2026 with its “Community-First AI Infrastructure Initiative,” a framework built around five core commitments. The company pledged to minimize electricity cost impacts from its data centers, pursue sustainable water use, fund local education programs, and create jobs in the communities where it builds.
In West Des Moines, Iowa, a Microsoft CBA is projected to generate over $2 billion in tax revenue. The deal also promises at least 3,000 construction jobs and 400 permanent positions.
Advertisement
Amazon, meanwhile, went even bigger in northern Indiana. The company committed $15 billion to a data center complex that would create 1,100 new jobs and fund utility infrastructure upgrades alongside K-12 STEM education programs.
The $29 billion electricity problem
PJM Interconnection, the regional grid operator covering up to 14 states across the mid-Atlantic and Midwest, has tied data center demand to roughly $29 billion in added electricity costs for utility customers since capacity auctions ramped up in 2024. The latest capacity auction in June 2026 alone is estimated to add $6.3 billion in impact through 2028.
AI, tech, and the markets they move—in one daily briefing.
Daily. Free. Join 34,000+ readers across crypto, finance, and policy.
Crypto mining operations, particularly those connected to ERCOT (the Texas grid operator), act as large-load demands that contribute to the same infrastructure strain and consumer cost pressures. Every megawatt consumed by a Bitcoin mining facility is a megawatt that Amazon or Microsoft would happily pay a premium for. And unlike miners, whose revenue fluctuates with token prices and halving cycles, hyperscalers can sign 15-year power purchase agreements backed by trillion-dollar balance sheets.
Some miners have pivoted to offering flexible load services, essentially agreeing to shut down during peak demand in exchange for cheaper rates. Others are relocating to regions with surplus renewable energy.
What this means for investors
For crypto miners and related equities, the key risk is displacement. As hyperscalers lock up power capacity through long-term contracts and community agreements, the available supply for mining operations shrinks. Companies like Riot Platforms and Marathon Digital have already been diversifying into AI hosting for exactly this reason.
Investors should watch two things closely. First, how PJM and other grid operators handle capacity pricing as data center demand continues to climb through 2028. Second, whether state legislatures start mandating CBAs as a condition for data center permits, which would formalize the cost of doing business and potentially squeeze out operators who can’t afford to play the community investment game.
Disclosure: This article was edited by Editorial Team. For more information on how we create and review content, see our Editorial Policy.
AI, tech, and the markets they move—in one daily briefing.Daily. Free. Join 34,000+ readers across crypto, finance, and policy.
Free daily briefing
Crypto Briefing Pro
The news about what you hold
Follow your stocks and crypto. Read the news about them from hundreds of publishers in Pro.