+34.3% (FY ended 2025-12-27 vs FY ended 2024-12-28) 10-K
Annual net income
4,335,000,000 USD (FY ended 2025-12-27, attributable to the company) 10-K
Annual operating margin
10.7% (FY ended 2025-12-27)
Forward P/E
Unavailable: no dated forecast source
Gloria daily close for session Oct 29, 2026. Market cap and trailing P/E use this close with the SEC share total and trailing diluted earnings, each dated next to its figure. Annual revenue, revenue growth, net income and margin show their own fiscal period and link the 10-K. Current context may postdate this article.
−267,000,000FY ended 2025-12-27, attributable to the company · 10-K
−4.2%FY ended 2025-12-27
Missing figures stay unavailable. Forward P/E requires a dated source. Annual revenue, revenue growth, net income and margin come from each company's own 10-K, in US dollars, and each row shows that fiscal year. Revenue growth compares the fiscal year with the prior year stated in the same 10-K. Net income is the full year amount attributable to the company, or available to common stockholders where the filing states only that, or consolidated net income. Each row names its basis. Trailing P/E reads "Not meaningful" when the dated trailing diluted EPS is a loss or zero. An operating margin appears only when the filing states both the operating income and the revenue for the same year.
Sources: SEC filings, Gloria daily closes and CoinGecko. Oldest record refresh: Oct 29, 2026, 1:01 PM EDT. Refresh is not a price or filing date. Each row shows its price date and its annual fiscal period. Peers use industry code and company size, or editorial selection. Market cap multiplies that row price by the company share total the latest SEC filing states for every share class together. Trailing P/E divides it by trailing diluted earnings from SEC filings. Rolled earnings per share are approximate because share counts can change between periods. Both appear only when the SEC data carries its date, so they are estimates at one price date, not synchronized filing valuations. Not investment advice.
Token vs underlying stock
Current comparison for AMD. Historical observations may postdate this article.
Split-adjusted regular-session stock closes from the existing Gloria shared history, paired only with an observed token price within 45 minutes of 16:00 New York time. Up to 60 matched sessions. No interpolation or missing-date fill. Weekends and known early closes are omitted. Token units are not adjusted for issuer multipliers or dividend treatment. This compares quoted prices, not fair value, executable premiums or arbitrage returns. Solid line: token. Dashed line: stock. Exact quote times and values appear below. Historical observations. Retrieval refers to the token source. Token quote times use UTC. The fixed cohort shows its oldest member fetch.
AMD token vs AMD stock: exact source values
Date (UTC)
Token (USD)
Stock close (USD)
Token quote (UTC)
2026-08-06
489.75
489.28
2026-08-06 20:00
2026-08-07
483.12
483.36
2026-08-07 20:00
2026-08-10
470.08
469.56
2026-08-10 20:00
2026-08-11
469.58
474.32
2026-08-11 20:00
2026-08-12
486.62
482.93
2026-08-12 20:00
2026-08-13
483.55
483.01
2026-08-13 20:00
2026-08-14
513.09
514.39
2026-08-14 20:00
2026-08-17
505.47
506.00
2026-08-17 20:00
2026-08-18
482.45
484.39
2026-08-18 20:00
2026-08-19
466.15
466.42
2026-08-19 20:00
2026-08-20
467.56
469.46
2026-08-20 20:00
2026-08-21
473.60
473.25
2026-08-21 20:00
2026-08-24
457.55
456.75
2026-08-24 20:00
2026-08-25
479.41
479.18
2026-08-25 20:00
2026-08-26
480.52
480.93
2026-08-26 20:00
2026-08-27
474.81
476.67
2026-08-27 20:00
2026-08-28
465.95
465.58
2026-08-28 20:00
2026-08-31
470.18
470.72
2026-08-31 20:00
2026-09-01
459.91
459.61
2026-09-01 20:00
2026-09-02
459.21
457.06
2026-09-02 20:00
2026-09-03
444.08
456.16
2026-09-03 20:00
2026-09-04
476.62
477.57
2026-09-04 20:00
2026-09-08
500.35
505.74
2026-09-08 20:00
2026-09-09
519.73
521.10
2026-09-09 20:00
2026-09-10
503.99
503.60
2026-09-10 20:00
2026-09-11
514.38
516.13
2026-09-11 20:00
2026-09-14
481.66
493.41
2026-09-14 20:00
2026-09-15
504.27
504.20
2026-09-15 20:00
2026-09-16
512.46
512.50
2026-09-16 20:00
2026-09-17
545.14
545.09
2026-09-17 20:00
2026-09-18
557.88
559.82
2026-09-18 20:00
2026-09-21
615.34
615.52
2026-09-21 20:00
2026-09-22
622.08
623.77
2026-09-22 20:00
2026-09-23
613.66
614.61
2026-09-23 20:00
2026-09-24
629.06
629.26
2026-09-24 20:00
2026-09-25
630.70
630.63
2026-09-25 20:00
2026-09-28
607.85
607.87
2026-09-28 20:00
2026-09-29
607.09
607.57
2026-09-29 20:00
2026-09-30
611.52
611.76
2026-09-30 20:00
2026-10-01
616.95
615.73
2026-10-01 20:00
2026-10-02
633.03
633.91
2026-10-02 20:00
2026-10-05
630.87
631.75
2026-10-05 20:00
2026-10-06
648.78
649.42
2026-10-06 20:00
2026-10-07
645.86
645.86
2026-10-07 20:00
2026-10-08
620.92
620.68
2026-10-08 20:00
2026-10-09
607.57
608.10
2026-10-09 20:00
2026-10-12
593.94
594.24
2026-10-12 20:00
2026-10-13
605.81
605.53
2026-10-13 20:00
2026-10-14
571.93
570.82
2026-10-14 20:00
2026-10-15
562.54
562.23
2026-10-15 20:00
2026-10-16
530.05
528.75
2026-10-16 20:00
2026-10-19
538.50
538.05
2026-10-19 20:00
2026-10-20
534.45
534.74
2026-10-20 20:00
2026-10-21
553.67
552.72
2026-10-21 20:00
2026-10-22
508.65
507.93
2026-10-22 20:00
2026-10-23
515.90
516.79
2026-10-23 20:00
2026-10-26
531.61
531.28
2026-10-26 20:00
2026-10-27
560.31
560.26
2026-10-27 20:00
2026-10-28
578.45
578.44
2026-10-28 20:00
2026-10-29
565.96
566.42
2026-10-29 20:00
Stock history: Gloria · Retrieved Oct 30, 00:32 UTC. Token history: CoinGecko AMDx.
Quoted token and share units can have different rights, multipliers and dividend treatment. This is not an executable premium or arbitrage signal.
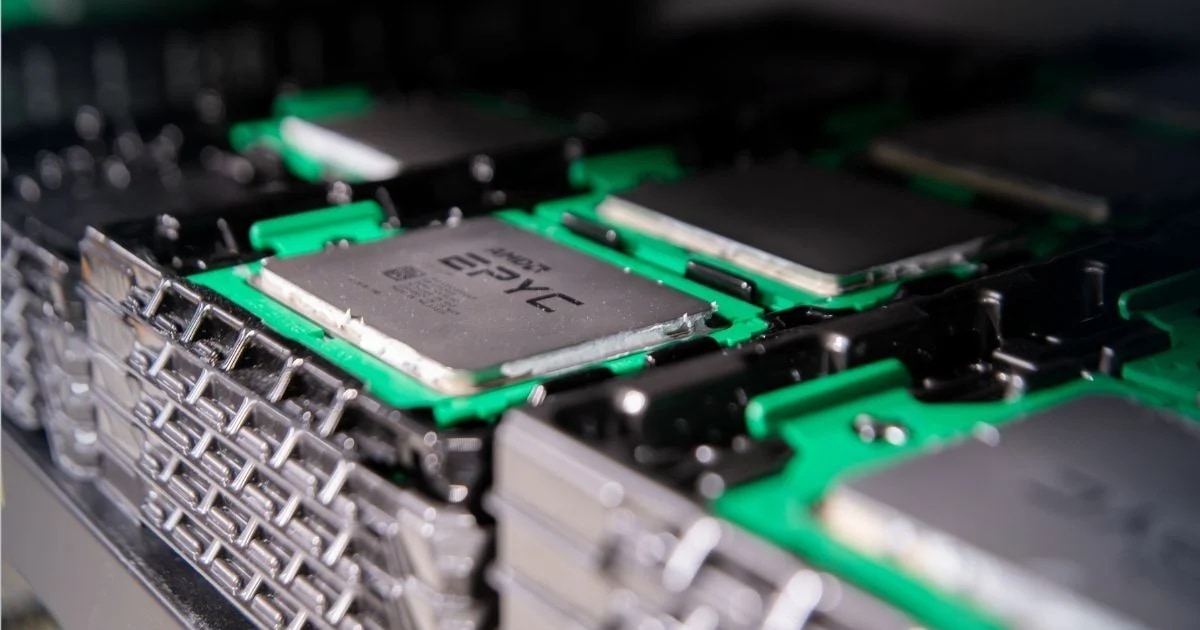
AMD just wrote what might be the biggest check in its history, and it’s not buying a company. It’s buying a seat at the AI table.
The chipmaker announced a sweeping partnership with Anthropic that includes selling the AI startup up to 2 gigawatts of its MI450 Series GPUs and investing up to $5 billion in equity in the company. The GPU sales alone are expected to generate “tens of billions of dollars” in revenue.
The deal structure
Anthropic, the maker of the Claude family of AI models, will deploy AMD’s Instinct MI450 Series GPUs across what AMD calls its Helios rack-scale solutions. The first gigawatt of compute capacity is expected to come online in the first half of 2027, with the full 2 gigawatts rolling out over a longer timeline.
The $5 billion equity investment is not a single lump sum. It’s contingent on deployment milestones being achieved, meaning AMD only deepens its financial commitment as Anthropic actually plugs in the hardware and puts it to work.
Why this matters for the AI chip wars
AMD has been the scrappy challenger, offering competitive silicon at better price-to-performance ratios but struggling to convince major AI labs to build their entire infrastructure stacks around non-Nvidia hardware. This deal changes that calculus considerably.
AI, tech, and the markets they move—in one daily briefing.
Daily. Free. Join 34,000+ readers across crypto, finance, and policy.
The financial scale also tells a story. “Tens of billions of dollars” in GPU sales dwarfs most semiconductor supply agreements. For context, AMD’s entire data center segment generated $12.6 billion in revenue in 2024. A single deal that could multiply that figure over its lifetime represents a transformational shift in AMD’s business mix.
What Anthropic gets out of it
Anthropic has raised significant capital from multiple sources, including Amazon, which has committed billions to the company. Adding AMD as both a hardware supplier and equity investor gives Anthropic supply chain diversification and reduces concentration risk on any single GPU vendor.
What this means for investors
For AMD shareholders, this is the kind of deal that reframes the investment thesis. If the deployment milestones are met and the GPU sales materialize at the scale described, AMD’s data center revenue trajectory could look dramatically different over the next several years.
The milestone-based structure of the $5 billion equity investment is worth watching closely. If deployment proceeds on schedule, with the first gigawatt operational by mid-2027, it validates AMD’s hardware at a scale that no benchmark or demo can replicate.
Disclosure: This article was edited by Editorial Team. For more information on how we create and review content, see our Editorial Policy.