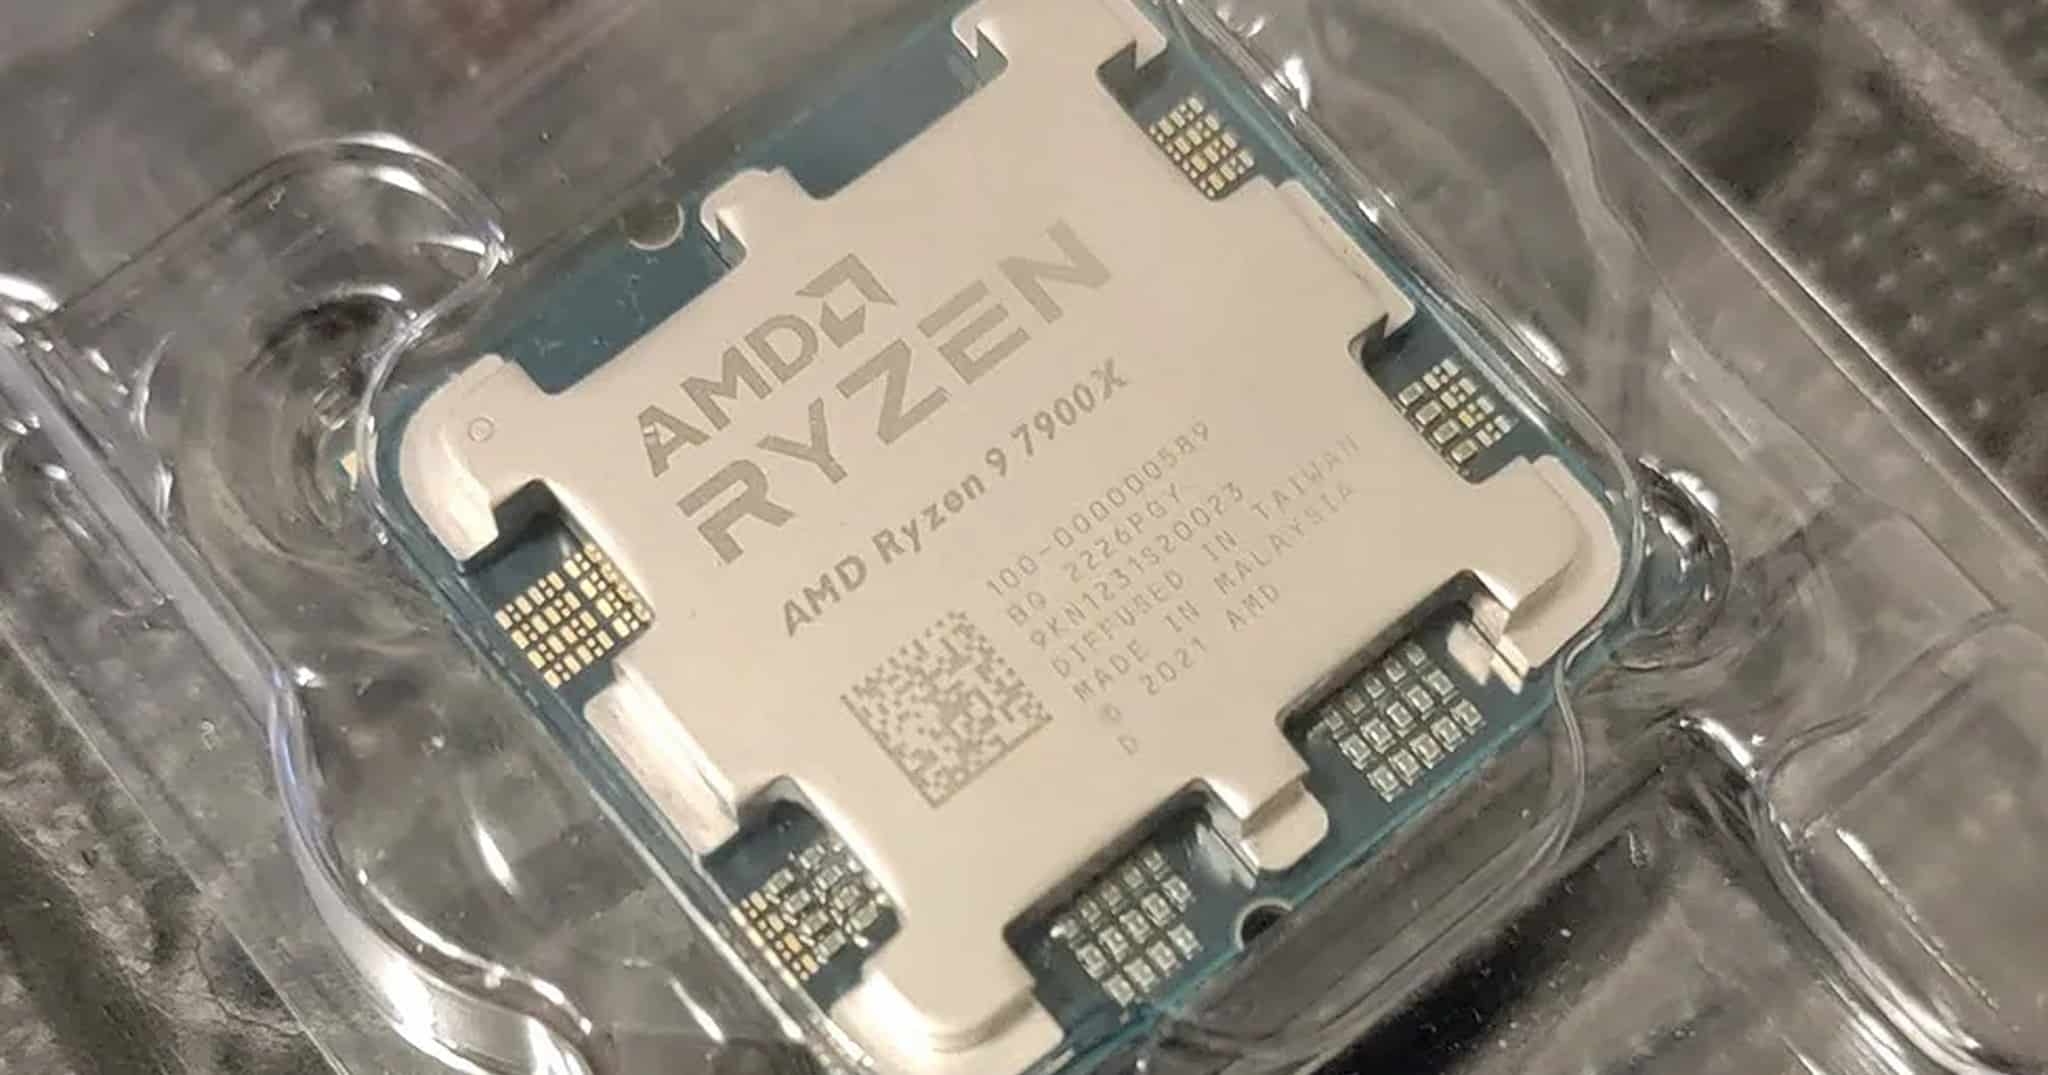
Advanced Micro Devices stock rebounds after massive AI research expansion
AMD's £2 billion UK investment and multi-gigawatt GPU deals with Meta and OpenAI are reshaping the semiconductor landscape, with ripple effects reaching crypto's AI token market.
+34.3% (FY ended 2025-12-27 vs FY ended 2024-12-28) 10-K
Annual net income
4,335,000,000 USD (FY ended 2025-12-27, attributable to the company) 10-K
Annual operating margin
10.7% (FY ended 2025-12-27)
Forward P/E
Unavailable: no dated forecast source
Gloria daily close for session Oct 27, 2026. Market cap and trailing P/E use this close with the SEC share total and trailing diluted earnings, each dated next to its figure. Annual revenue, revenue growth, net income and margin show their own fiscal period and link the 10-K. Current context may postdate this article.
−267,000,000FY ended 2025-12-27, attributable to the company · 10-K
−4.2%FY ended 2025-12-27
Missing figures stay unavailable. Forward P/E requires a dated source. Annual revenue, revenue growth, net income and margin come from each company's own 10-K, in US dollars, and each row shows that fiscal year. Revenue growth compares the fiscal year with the prior year stated in the same 10-K. Net income is the full year amount attributable to the company, or available to common stockholders where the filing states only that, or consolidated net income. Each row names its basis. Trailing P/E reads "Not meaningful" when the dated trailing diluted EPS is a loss or zero. An operating margin appears only when the filing states both the operating income and the revenue for the same year.
Sources: SEC filings, Gloria daily closes and CoinGecko. Oldest record refresh: Oct 28, 2026, 4:56 PM EDT. Refresh is not a price or filing date. Each row shows its price date and its annual fiscal period. Peers use industry code and company size, or editorial selection. Market cap multiplies that row price by the company share total the latest SEC filing states for every share class together. Trailing P/E divides it by trailing diluted earnings from SEC filings. Rolled earnings per share are approximate because share counts can change between periods. Both appear only when the SEC data carries its date, so they are estimates at one price date, not synchronized filing valuations. Not investment advice.
Token vs underlying stock
Current comparison for AMD. Historical observations may postdate this article.
Split-adjusted regular-session stock closes from the existing Gloria shared history, paired only with an observed token price within 45 minutes of 16:00 New York time. Up to 60 matched sessions. No interpolation or missing-date fill. Weekends and known early closes are omitted. Token units are not adjusted for issuer multipliers or dividend treatment. This compares quoted prices, not fair value, executable premiums or arbitrage returns. Solid line: token. Dashed line: stock. Exact quote times and values appear below. Historical observations. Retrieval refers to the token source. Token quote times use UTC. The fixed cohort shows its oldest member fetch.
AMD token vs AMD stock: exact source values
Date (UTC)
Token (USD)
Stock close (USD)
Token quote (UTC)
2026-08-04
521.75
518.58
2026-08-04 20:00
2026-08-05
487.24
482.05
2026-08-05 20:00
2026-08-06
489.75
489.28
2026-08-06 20:00
2026-08-07
483.12
483.36
2026-08-07 20:00
2026-08-10
470.08
469.56
2026-08-10 20:00
2026-08-11
469.58
474.32
2026-08-11 20:00
2026-08-12
486.62
482.93
2026-08-12 20:00
2026-08-13
483.55
483.01
2026-08-13 20:00
2026-08-14
513.09
514.39
2026-08-14 20:00
2026-08-17
505.47
506.00
2026-08-17 20:00
2026-08-18
482.45
484.39
2026-08-18 20:00
2026-08-19
466.15
466.42
2026-08-19 20:00
2026-08-20
467.56
469.46
2026-08-20 20:00
2026-08-21
473.60
473.25
2026-08-21 20:00
2026-08-24
457.55
456.75
2026-08-24 20:00
2026-08-25
479.41
479.18
2026-08-25 20:00
2026-08-26
480.52
480.93
2026-08-26 20:00
2026-08-27
474.81
476.67
2026-08-27 20:00
2026-08-28
465.95
465.58
2026-08-28 20:00
2026-08-31
470.18
470.72
2026-08-31 20:00
2026-09-01
459.91
459.61
2026-09-01 20:00
2026-09-02
459.21
457.06
2026-09-02 20:00
2026-09-03
444.08
456.16
2026-09-03 20:00
2026-09-04
476.62
477.57
2026-09-04 20:00
2026-09-08
500.35
505.74
2026-09-08 20:00
2026-09-09
519.73
521.10
2026-09-09 20:00
2026-09-10
503.99
503.60
2026-09-10 20:00
2026-09-11
514.38
516.13
2026-09-11 20:00
2026-09-14
481.66
493.41
2026-09-14 20:00
2026-09-15
504.27
504.20
2026-09-15 20:00
2026-09-16
512.46
512.50
2026-09-16 20:00
2026-09-17
545.14
545.09
2026-09-17 20:00
2026-09-18
557.88
559.82
2026-09-18 20:00
2026-09-21
615.34
615.52
2026-09-21 20:00
2026-09-22
622.08
623.77
2026-09-22 20:00
2026-09-23
613.66
614.61
2026-09-23 20:00
2026-09-24
629.06
629.26
2026-09-24 20:00
2026-09-25
630.70
630.63
2026-09-25 20:00
2026-09-28
607.85
607.87
2026-09-28 20:00
2026-09-29
607.09
607.57
2026-09-29 20:00
2026-09-30
611.52
611.76
2026-09-30 20:00
2026-10-01
616.95
615.73
2026-10-01 20:00
2026-10-02
633.03
633.91
2026-10-02 20:00
2026-10-05
630.87
631.75
2026-10-05 20:00
2026-10-06
648.78
649.42
2026-10-06 20:00
2026-10-07
645.86
645.86
2026-10-07 20:00
2026-10-08
620.92
620.68
2026-10-08 20:00
2026-10-09
607.57
608.10
2026-10-09 20:00
2026-10-12
593.94
594.24
2026-10-12 20:00
2026-10-13
605.81
605.53
2026-10-13 20:00
2026-10-14
571.93
570.82
2026-10-14 20:00
2026-10-15
562.54
562.23
2026-10-15 20:00
2026-10-16
530.05
528.75
2026-10-16 20:00
2026-10-19
538.50
538.05
2026-10-19 20:00
2026-10-20
534.45
534.74
2026-10-20 20:00
2026-10-21
553.67
552.72
2026-10-21 20:00
2026-10-22
508.65
507.93
2026-10-22 20:00
2026-10-23
515.90
516.79
2026-10-23 20:00
2026-10-26
531.61
531.28
2026-10-26 20:00
2026-10-27
560.31
560.26
2026-10-27 20:00
Stock history: Gloria · Retrieved Oct 28, 00:31 UTC. Token history: CoinGecko AMDx.
Quoted token and share units can have different rights, multipliers and dividend treatment. This is not an executable premium or arbitrage signal.
AMD just dropped £2 billion on the table for AI research in the United Kingdom, announced on June 8. The five-year commitment includes partnerships with Imperial College London and Oriole Networks, targeting national AI supercomputing capabilities through systems called Zenith and Sunrise.
The deals powering the rally
Meta has signed a multiyear commitment for up to 6 GW of AMD GPUs. Then there’s OpenAI, which has entered a multibillion-dollar agreement for 6 GW of AMD’s MI450 chips.
Wells Fargo raised its AMD price target to $615, while Bank of America bumped its target to $560. Both upgrades reflect expectations that AI-driven revenue growth will continue accelerating through the rest of 2026.
AMD’s Instinct GPUs and its ROCm software stack are the products at the center of this story, positioned to compete directly with Nvidia’s dominant CUDA ecosystem.
Why crypto investors should care
AMD’s GPUs were workhorses during the crypto mining boom, powering Ethereum mining rigs before the network’s shift to proof-of-stake in 2022. Projects built around decentralized computing, GPU marketplaces, and AI-powered protocols all depend on the same fundamental hardware that AMD is now mass-producing for Meta and OpenAI.
AI, tech, and the markets they move—in one daily briefing.
Daily. Free. Join 34,000+ readers across crypto, finance, and policy.
AI-focused tokens have shown mixed performance recently. The US government’s ongoing deliberations about chip export controls add another variable: any restrictions that limit where AMD can ship its most advanced processors could tighten supply for decentralized AI networks that operate globally, potentially creating price pressure on tokens tied to GPU availability.
The July catalyst
AMD has its Advancing AI event scheduled for July 22-23, 2026, where the company is expected to showcase new technological platforms and product launches aimed at strengthening its data center AI business.
What to watch from here
AMD’s manufacturing partner TSMC is already operating at high utilization, so capacity constraints remain a real concern for executing on the Meta and OpenAI GPU agreements.
As AMD ramps production for its enterprise customers, older-generation chips tend to flow into the resale market. A flood of previous-gen Instinct GPUs hitting the market could be a tailwind for decentralized AI protocols that are currently constrained by hardware costs.
Disclosure: This article was edited by Editorial Team. For more information on how we create and review content, see our Editorial Policy.