+6.4% (FY ended 2025-09-27 vs FY ended 2024-09-28) 10-K
Annual net income
112,010,000,000 USD (FY ended 2025-09-27, attributable to the company) 10-K
Annual operating margin
32.0% (FY ended 2025-09-27)
Forward P/E
Unavailable: no dated forecast source
Gloria daily close for session Oct 28, 2026. Market cap and trailing P/E use this close with the SEC share total and trailing diluted earnings, each dated next to its figure. Annual revenue, revenue growth, net income and margin show their own fiscal period and link the 10-K. Current context may postdate this article.
Apple Inc. and its peers
Company
Price
Market cap
P/E (trailing)
Forward P/E
Annual revenue (USD)
Annual revenue growth
Annual net income (USD)
Operating margin
Apple Inc.
AAPL · Price dated Oct 28, 2026 · tokenized AAPLx
13,267,000,000FY ended 2026-07-25, attributable to the company · 10-K
24.3%FY ended 2026-07-25
Missing figures stay unavailable. Forward P/E requires a dated source. Annual revenue, revenue growth, net income and margin come from each company's own 10-K, in US dollars, and each row shows that fiscal year. Revenue growth compares the fiscal year with the prior year stated in the same 10-K. Net income is the full year amount attributable to the company, or available to common stockholders where the filing states only that, or consolidated net income. Each row names its basis. Trailing P/E reads "Not meaningful" when the dated trailing diluted EPS is a loss or zero. An operating margin appears only when the filing states both the operating income and the revenue for the same year.
Sources: SEC filings, Gloria daily closes and CoinGecko. Oldest record refresh: Oct 28, 2026, 4:46 PM EDT. Refresh is not a price or filing date. Each row shows its price date and its annual fiscal period. Peers use industry code and company size, or editorial selection. Market cap multiplies that row price by the company share total the latest SEC filing states for every share class together. Trailing P/E divides it by trailing diluted earnings from SEC filings. Rolled earnings per share are approximate because share counts can change between periods. Both appear only when the SEC data carries its date, so they are estimates at one price date, not synchronized filing valuations. Not investment advice.
Token vs underlying stock
Current comparison for AAPL. Historical observations may postdate this article.
Split-adjusted regular-session stock closes from the existing Gloria shared history, paired only with an observed token price within 45 minutes of 16:00 New York time. Up to 60 matched sessions. No interpolation or missing-date fill. Weekends and known early closes are omitted. Token units are not adjusted for issuer multipliers or dividend treatment. This compares quoted prices, not fair value, executable premiums or arbitrage returns. Solid line: token. Dashed line: stock. Exact quote times and values appear below. Historical observations. Retrieval refers to the token source. Token quote times use UTC. The fixed cohort shows its oldest member fetch.
Apple token vs Apple stock: exact source values
Date (UTC)
Token (USD)
Stock close (USD)
Token quote (UTC)
2026-08-05
311.72
311.00
2026-08-05 20:00
2026-08-06
312.78
312.41
2026-08-06 20:00
2026-08-07
313.83
313.33
2026-08-07 20:00
2026-08-10
308.62
308.26
2026-08-10 20:00
2026-08-11
305.37
304.91
2026-08-11 20:00
2026-08-12
302.83
302.25
2026-08-12 20:00
2026-08-13
305.79
305.26
2026-08-13 20:00
2026-08-14
306.96
305.93
2026-08-14 20:00
2026-08-17
306.25
305.59
2026-08-17 20:00
2026-08-18
311.31
310.03
2026-08-18 20:00
2026-08-19
317.34
316.83
2026-08-19 20:00
2026-08-20
311.74
311.30
2026-08-20 20:00
2026-08-21
310.51
309.35
2026-08-21 20:00
2026-08-24
311.44
310.34
2026-08-24 20:00
2026-08-25
310.87
309.90
2026-08-25 20:00
2026-08-26
314.52
313.45
2026-08-26 20:00
2026-08-27
315.05
314.58
2026-08-27 20:00
2026-08-28
320.36
319.70
2026-08-28 20:00
2026-08-31
317.65
316.85
2026-08-31 20:00
2026-09-01
325.59
325.13
2026-09-01 20:00
2026-09-02
325.80
324.96
2026-09-02 20:00
2026-09-03
329.13
328.21
2026-09-03 20:00
2026-09-04
321.11
319.97
2026-09-04 20:00
2026-09-08
316.85
316.22
2026-09-08 20:00
2026-09-09
316.30
315.34
2026-09-09 20:00
2026-09-10
327.20
326.57
2026-09-10 20:00
2026-09-11
333.36
332.27
2026-09-11 20:00
2026-09-14
334.25
333.08
2026-09-14 20:00
2026-09-15
331.88
331.34
2026-09-15 20:00
2026-09-16
333.36
332.41
2026-09-16 20:00
2026-09-17
337.97
337.00
2026-09-17 20:00
2026-09-18
337.26
336.13
2026-09-18 20:00
2026-09-21
340.11
338.98
2026-09-21 20:00
2026-09-22
340.64
339.75
2026-09-22 20:00
2026-09-23
337.57
337.02
2026-09-23 20:00
2026-09-24
337.27
335.92
2026-09-24 20:00
2026-09-25
341.92
341.07
2026-09-25 20:00
2026-09-28
339.71
338.40
2026-09-28 20:00
2026-09-29
330.45
329.40
2026-09-29 20:00
2026-09-30
334.56
333.02
2026-09-30 20:00
2026-10-01
331.46
330.32
2026-10-01 20:00
2026-10-02
334.68
333.69
2026-10-02 20:00
2026-10-05
333.54
332.89
2026-10-05 20:00
2026-10-06
334.55
333.63
2026-10-06 20:00
2026-10-07
337.28
336.67
2026-10-07 20:00
2026-10-08
341.31
340.42
2026-10-08 20:00
2026-10-09
337.58
336.64
2026-10-09 20:00
2026-10-12
341.95
340.97
2026-10-12 20:00
2026-10-13
342.44
341.27
2026-10-13 20:00
2026-10-14
344.06
342.96
2026-10-14 20:00
2026-10-15
343.24
342.00
2026-10-15 20:00
2026-10-16
344.31
343.46
2026-10-16 20:00
2026-10-19
344.18
342.94
2026-10-19 20:00
2026-10-20
340.65
339.50
2026-10-20 20:00
2026-10-21
344.81
343.99
2026-10-21 20:00
2026-10-22
349.21
348.22
2026-10-22 20:00
2026-10-23
348.46
347.73
2026-10-23 20:00
2026-10-26
344.87
343.91
2026-10-26 20:00
2026-10-27
348.00
347.10
2026-10-27 20:00
2026-10-28
345.12
343.83
2026-10-28 20:00
Stock history: Gloria · Retrieved Oct 29, 00:31 UTC. Token history: CoinGecko AAPLx.
Quoted token and share units can have different rights, multipliers and dividend treatment. This is not an executable premium or arbitrage signal.
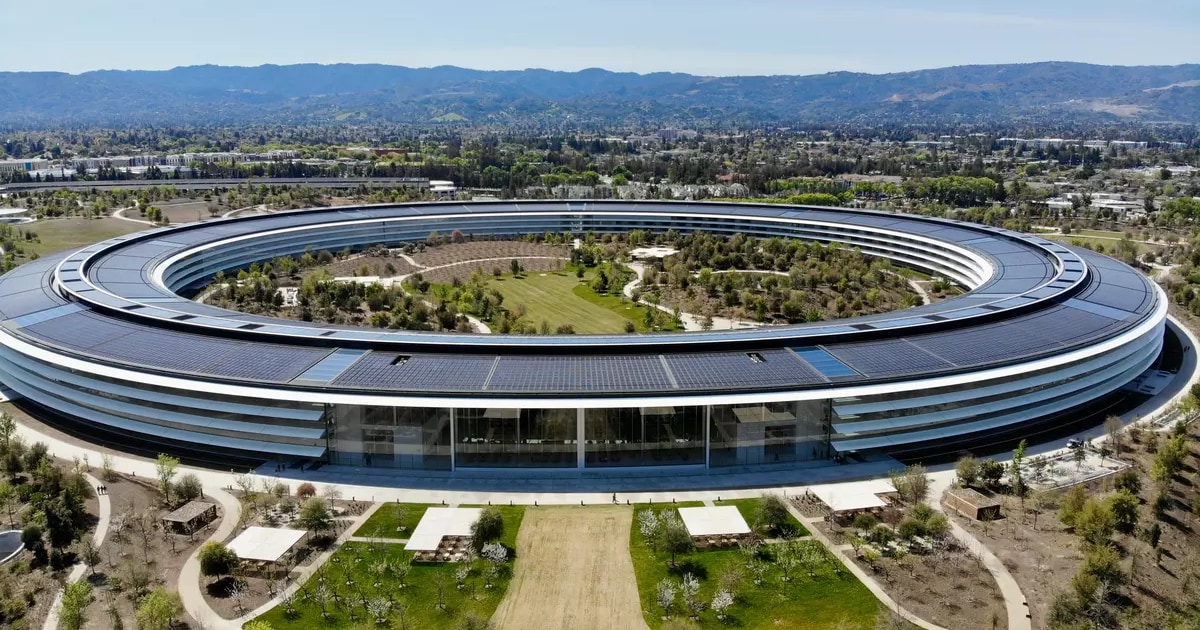
Apple is knocking on the door of a $5 trillion market capitalization, sitting roughly $250 billion away from a number so large it stops feeling like money and starts feeling like a weather system. The company’s valuation has climbed to approximately $4.63 trillion to $4.73 trillion, with shares hitting an all-time high above $321 on July 13.
To put $5 trillion in perspective: it’s larger than the entire GDP of Japan. And Apple is close enough to taste it.
The road to an absurd number
Apple became the world’s first company to reach a $1 trillion market cap back in 2018. Multiple analysts now project Apple could surpass the $5 trillion mark before the end of 2026.
Here’s the thing: Apple wouldn’t even be the first to get there. Nvidia crossed the $5 trillion threshold earlier, becoming the first company in history to reach that valuation during 2025’s AI-fueled market surge. Microsoft also joined the $4 trillion club in late 2025, meaning the top of the tech market has turned into a very exclusive, very expensive neighborhood.
What’s actually driving the valuation
The bull case for Apple at these levels rests on a few pillars. Consumer electronics remain the backbone, with iPhone revenue still accounting for the lion’s share of sales. But the narrative has shifted meaningfully toward services and, increasingly, AI integration.
AI, tech, and the markets they move—in one daily briefing.
Daily. Free. Join 34,000+ readers across crypto, finance, and policy.
The stock’s climb to a record above $321 reflects that confidence. Look at the trajectory: from the first trillion in 2018 to nearly five trillion in mid-2026. That’s roughly 4x growth in eight years for a company already valued higher than most countries’ economic output when the clock started.
The macro backdrop matters
Apple’s march toward $5 trillion isn’t happening in isolation. Nvidia’s earlier achievement of the $5 trillion milestone set the psychological precedent that these numbers are attainable, not just theoretical. Both Nvidia and Microsoft crossing the $4 trillion valuation threshold in late 2025 established a clear pattern: the market is willing to assign historically unprecedented valuations to companies positioned at the center of the AI infrastructure and application layers.
Recent analyses show no significant ties between Apple and cryptocurrency or blockchain technologies, with current market conditions predominantly focused on traditional equity valuations in the technology sector.
Disclosure: This article was edited by Editorial Team. For more information on how we create and review content, see our Editorial Policy.