+6.4% (FY ended 2025-09-27 vs FY ended 2024-09-28) 10-K
Annual net income
112,010,000,000 USD (FY ended 2025-09-27, attributable to the company) 10-K
Annual operating margin
32.0% (FY ended 2025-09-27)
Forward P/E
Unavailable: no dated forecast source
Gloria daily close for session Oct 27, 2026. Market cap and trailing P/E use this close with the SEC share total and trailing diluted earnings, each dated next to its figure. Annual revenue, revenue growth, net income and margin show their own fiscal period and link the 10-K. Current context may postdate this article.
Apple Inc. and its peers
Company
Price
Market cap
P/E (trailing)
Forward P/E
Annual revenue (USD)
Annual revenue growth
Annual net income (USD)
Operating margin
Apple Inc.
AAPL · Price dated Oct 27, 2026 · tokenized AAPLx
13,267,000,000FY ended 2026-07-25, attributable to the company · 10-K
24.3%FY ended 2026-07-25
Missing figures stay unavailable. Forward P/E requires a dated source. Annual revenue, revenue growth, net income and margin come from each company's own 10-K, in US dollars, and each row shows that fiscal year. Revenue growth compares the fiscal year with the prior year stated in the same 10-K. Net income is the full year amount attributable to the company, or available to common stockholders where the filing states only that, or consolidated net income. Each row names its basis. Trailing P/E reads "Not meaningful" when the dated trailing diluted EPS is a loss or zero. An operating margin appears only when the filing states both the operating income and the revenue for the same year.
Sources: SEC filings, Gloria daily closes and CoinGecko. Oldest record refresh: Oct 27, 2026, 8:43 PM EDT. Refresh is not a price or filing date. Each row shows its price date and its annual fiscal period. Peers use industry code and company size, or editorial selection. Market cap multiplies that row price by the company share total the latest SEC filing states for every share class together. Trailing P/E divides it by trailing diluted earnings from SEC filings. Rolled earnings per share are approximate because share counts can change between periods. Both appear only when the SEC data carries its date, so they are estimates at one price date, not synchronized filing valuations. Not investment advice.
Token vs underlying stock
Current comparison for AAPL. Historical observations may postdate this article.
Split-adjusted regular-session stock closes from the existing Gloria shared history, paired only with an observed token price within 45 minutes of 16:00 New York time. Up to 60 matched sessions. No interpolation or missing-date fill. Weekends and known early closes are omitted. Token units are not adjusted for issuer multipliers or dividend treatment. This compares quoted prices, not fair value, executable premiums or arbitrage returns. Solid line: token. Dashed line: stock. Exact quote times and values appear below. Historical observations. Retrieval refers to the token source. Token quote times use UTC. The fixed cohort shows its oldest member fetch.
Apple token vs Apple stock: exact source values
Date (UTC)
Token (USD)
Stock close (USD)
Token quote (UTC)
2026-08-04
310.34
309.38
2026-08-04 20:00
2026-08-05
311.72
311.00
2026-08-05 20:00
2026-08-06
312.78
312.41
2026-08-06 20:00
2026-08-07
313.83
313.33
2026-08-07 20:00
2026-08-10
308.62
308.26
2026-08-10 20:00
2026-08-11
305.37
304.91
2026-08-11 20:00
2026-08-12
302.83
302.25
2026-08-12 20:00
2026-08-13
305.79
305.26
2026-08-13 20:00
2026-08-14
306.96
305.93
2026-08-14 20:00
2026-08-17
306.25
305.59
2026-08-17 20:00
2026-08-18
311.31
310.03
2026-08-18 20:00
2026-08-19
317.34
316.83
2026-08-19 20:00
2026-08-20
311.74
311.30
2026-08-20 20:00
2026-08-21
310.51
309.35
2026-08-21 20:00
2026-08-24
311.44
310.34
2026-08-24 20:00
2026-08-25
310.87
309.90
2026-08-25 20:00
2026-08-26
314.52
313.45
2026-08-26 20:00
2026-08-27
315.05
314.58
2026-08-27 20:00
2026-08-28
320.36
319.70
2026-08-28 20:00
2026-08-31
317.65
316.85
2026-08-31 20:00
2026-09-01
325.59
325.13
2026-09-01 20:00
2026-09-02
325.80
324.96
2026-09-02 20:00
2026-09-03
329.13
328.21
2026-09-03 20:00
2026-09-04
321.11
319.97
2026-09-04 20:00
2026-09-08
316.85
316.22
2026-09-08 20:00
2026-09-09
316.30
315.34
2026-09-09 20:00
2026-09-10
327.20
326.57
2026-09-10 20:00
2026-09-11
333.36
332.27
2026-09-11 20:00
2026-09-14
334.25
333.08
2026-09-14 20:00
2026-09-15
331.88
331.34
2026-09-15 20:00
2026-09-16
333.36
332.41
2026-09-16 20:00
2026-09-17
337.97
337.00
2026-09-17 20:00
2026-09-18
337.26
336.13
2026-09-18 20:00
2026-09-21
340.11
338.98
2026-09-21 20:00
2026-09-22
340.64
339.75
2026-09-22 20:00
2026-09-23
337.57
337.02
2026-09-23 20:00
2026-09-24
337.27
335.92
2026-09-24 20:00
2026-09-25
341.92
341.07
2026-09-25 20:00
2026-09-28
339.71
338.40
2026-09-28 20:00
2026-09-29
330.45
329.40
2026-09-29 20:00
2026-09-30
334.56
333.02
2026-09-30 20:00
2026-10-01
331.46
330.32
2026-10-01 20:00
2026-10-02
334.68
333.69
2026-10-02 20:00
2026-10-05
333.54
332.89
2026-10-05 20:00
2026-10-06
334.55
333.63
2026-10-06 20:00
2026-10-07
337.28
336.67
2026-10-07 20:00
2026-10-08
341.31
340.42
2026-10-08 20:00
2026-10-09
337.58
336.64
2026-10-09 20:00
2026-10-12
341.95
340.97
2026-10-12 20:00
2026-10-13
342.44
341.27
2026-10-13 20:00
2026-10-14
344.06
342.96
2026-10-14 20:00
2026-10-15
343.24
342.00
2026-10-15 20:00
2026-10-16
344.31
343.46
2026-10-16 20:00
2026-10-19
344.18
342.94
2026-10-19 20:00
2026-10-20
340.65
339.50
2026-10-20 20:00
2026-10-21
344.81
343.99
2026-10-21 20:00
2026-10-22
349.21
348.22
2026-10-22 20:00
2026-10-23
348.46
347.73
2026-10-23 20:00
2026-10-26
344.87
343.91
2026-10-26 20:00
2026-10-27
348.00
347.10
2026-10-27 20:00
Stock history: Gloria · Retrieved Oct 28, 00:31 UTC. Token history: CoinGecko AAPLx.
Quoted token and share units can have different rights, multipliers and dividend treatment. This is not an executable premium or arbitrage signal.
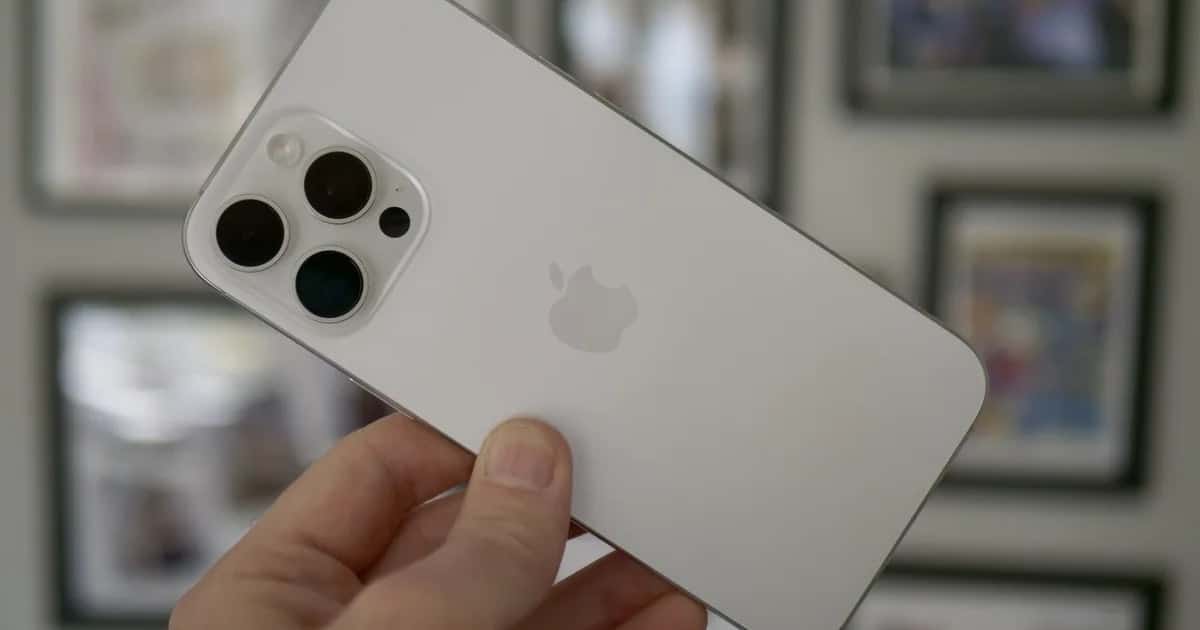
Apple just did something it almost never does: raise prices across its product lineup. And the shockwave didn’t stop at Cupertino.
On June 25, Apple increased prices on its Mac, iPad, and home device lines, blaming soaring costs for memory and storage chips. The result was swift and brutal. Apple shares dropped between 4.8% and 6.1%, erasing roughly $250 billion in market capitalization. That makes it the company’s worst single-day performance since April 2025. By the next morning in Asia, the damage had spread across the Pacific.
The Asian tech rout
SoftBank led the carnage on June 26, plunging as much as 11%. Samsung Electronics, SK Hynix, and TSMC all posted notable declines as investors reassessed the outlook for component demand.
Advertisement
CEO Tim Cook said the rising memory costs had become “unsustainable,” framing the price increases as a necessary adjustment rather than a strategic choice.
The Micron exception
Not every chip stock got hammered. Micron, one of the world’s largest memory chip manufacturers, actually rallied during the same period on stronger-than-expected earnings. That creates an interesting, almost paradoxical dynamic.
AI, tech, and the markets they move—in one daily briefing.
Daily. Free. Join 34,000+ readers across crypto, finance, and policy.
Think of it like oil prices spiking. The companies buying oil suffer. The companies selling oil benefit. Memory chip suppliers are in a similar position right now. Apple’s pain is, at least temporarily, their gain.
Why this matters beyond Apple
Apple’s decision marks a meaningful strategic shift for a company that built its empire partly on predictable pricing. Historically, Apple maintained stable or lowering selling prices while packing more technology into each generation. Microsoft has also raised prices for its gaming consoles during this same period, signaling a broader trend across the tech industry.
For investors, two indicators warrant close attention. First, how consumers respond to Apple’s higher prices over the next quarter. Second, the memory chip pricing cycle, where AI demand pushing memory prices higher only works for suppliers as long as total demand across all end markets stays robust.
The $250 billion that evaporated from Apple’s market cap in a single session is a stark reminder that even the most dominant companies aren’t immune to supply chain economics. And the 11% drop in SoftBank shows how quickly that vulnerability can cascade across borders and sectors.
Disclosure: This article was edited by Editorial Team. For more information on how we create and review content, see our Editorial Policy.
AI, tech, and the markets they move—in one daily briefing.Daily. Free. Join 34,000+ readers across crypto, finance, and policy.
Free daily briefing
Crypto Briefing Pro
The news about what you hold
Follow your stocks and crypto. Read the news about them from hundreds of publishers in Pro.