A Comparative Price Analysis of Exchange Tokens
Are exchange tokens priced fairly?

Share this article
Native exchange tokens have become a fairly widespread way for exchanges to fund their development. By creating native tokens and selling them to traders, exchanges have been able to raise capital to commence or enhance operations.
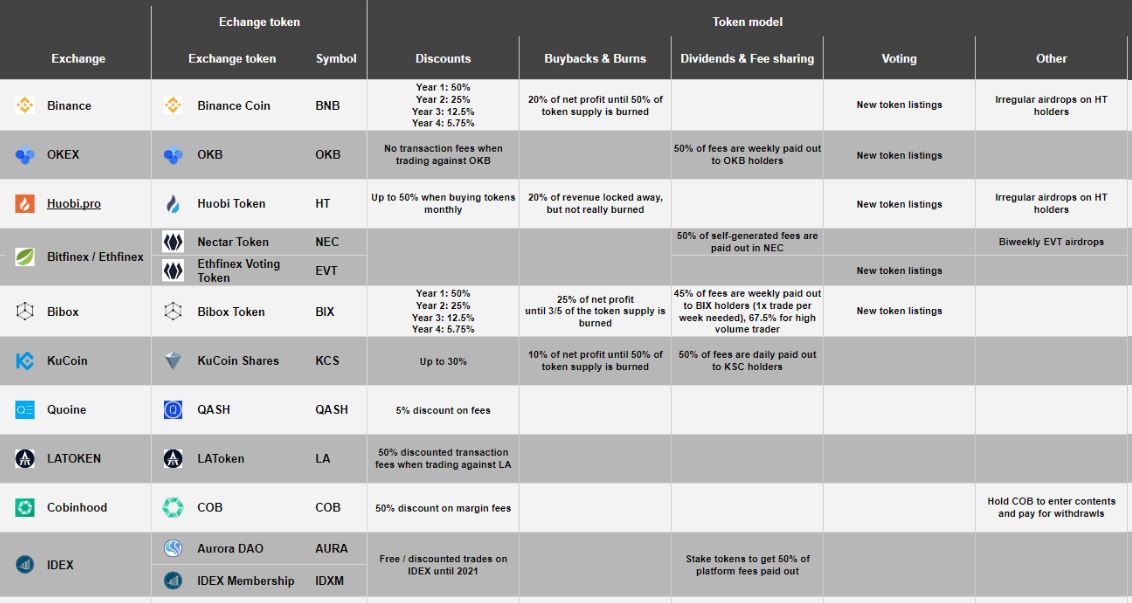
In return, investors in exchange tokens receive rewards. Those rewards take many different forms. One is the utility of reduced trading fees, dividend payouts and a share of exchange profits or revenues, in addition to access to airdrops and voting rights on new listings. There are many variants, summarised in the graph created by SICOS Publication below:

Many, but not all, issuers of exchange tokens also operate buybacks or/and burn events, whereby they burn a certain portion of the tokens over time, removing them permanently from circulation. The potential benefit for the crypto trader is that as the supply of tokens decreases, their value increases, ceteris paribus.
Again, the models vary widely in terms of the rate of token burns and their frequency. One commonality between token burns, however, is that they are funded by fees earned by the exchange over a particular period of time.
With all these variances in models, we took a deep dive into the possible values of five of the more prominent exchange tokens.
Exchange Token Value Determined by Multiple Factors
Native token value is a combination of their utility and their burn rates. Utility creates demand, whereas burning reduces supply. It possible to compare the market caps of the tokens, their burn rates, and exchange volumes to estimate the appropriateness of token prices. To make some comparisons, we calculated the price to burn ratios and token value to exchange volumes of BNB, HT, OKB, UNUS SED LEO, and KCS.
The token value to exchange volume metric is an adjusted approximation of traditional P/E ratios used in more established markets. We used daily volume as a proxy for earnings and circulating market cap of the token in place of price. By applying those measurements, we were able to account for the peculiarities of the cryptocurrency market and also the lack of reliable earnings figures.
Binance BNB
Binance originally created 200 million native tokens, BNB. The exchange has pledged to burn half of the total supply and recently conducted its 9th quarterly token burn. Using annual burn values provided by Maple Leaf Capital, we found BNB to have a price to burn ratio of around 44, based on circulating supply. That figure extends to 53 when its annual burn rate is compared to the total theoretical value (total supply X current price).
Using circulating supply figures, at current burn rates, (which are dictated by Binance’s profits), it would take 44 years to destroy all BNBs. As they plan to only burn half of the total supply, that figure falls to around 26.
In terms of token value to exchange volume, we used adjusted 24-hour trading volume as at press time to calculate the metric. The results showed that BNB’s market cap (which is calculated using circulating supply) is 3.9 times the exchange’s 24-hour volume.
With Binance’s native coin’s trading fee benefits falling over time, it appears somewhat overpriced by these metrics. However, the exchange has added utility to the BNB token since launching Binance Launchpad, so investors may be pricing in enhanced utility. CEO CZ certainly places an emphasis on the utility of BNB beyond trading fee discounts.

OKEx OKB
OKB metrics need to be treated with a grain of salt because, of the 300 million total supply, only twenty million are in circulation according to Coinmarketcap. Other sources have total supply at one billion, with 300 million circulating and 700 million locked up until 2022. Such is the wild and wonderful nature of the crypto ecosystem.
Running the same analysis over their token, with a current market cap around $63 million and an annual burn rate of $57 million, it would take little more than a year to burn their circulating supply of 20 million. It seems an unlikely figure, so we will assume a supply of 300 million, giving OKB a burn to price ratio of around 15.
In terms of the token’s value to daily OKEx exchange volume, it is a little over 0.1. That is, their trading volumes reach OKB’s market cap in less than three hours. If OKEx weren’t so opaque an exchange, their native tokens look extraordinarily well priced. This is especially true when one considers that their utility extends to zero trading fees when trading against OKB and 50 percent of fees earned are paid out weekly to OKB holders.
Yet, OKEx’s OKB figures are outliers – suggesting that a very cautious approach is warranted in determining a fair value for them. The analysis points to a model that is unsustainable, indicating unreliable data.
Huobi HT
Huobi’s most recent quarterly HT token burn represented a 70 percent year-on-year increase. With around $40 million worth of HT tokens condemned to the fire pit for Q3 2019, the exchange demonstrated it was achieving substantial profit growth. The company spends 20 percent of its Huobi Global and Huobi DM revenues on buying back HTs to burn.
At prices around $3.90, its token value to volume ratio was lower than Binance’s, at roughly 3.25. This suggests Huobi’s tokens offer slightly better value for money than Binance’s, largely reflecting growing revenues.
In terms of price to burn ratio, Huobi’s tokens appear well valued, at ten by circulating supply and 20 by total supply. On the surface, Huobi’s tokens are possibly slightly underpriced. Traders get reduced fees of up to 50 percent when they make monthly HT purchases, a maneuver that could ensure continued pressure on demand for HT. Basing its buyback rate on revenue means the company has an aggressive supply reduction policy.
KuCoin KCS
KCS tokens (shares) have a $130 million market cap. The exchange has 24-hour volumes of less than $28 million. This gives it a token value to volume ratio of around 4.7, meaning it takes the exchange almost a working week to reach volumes that equate to its circulating KCS value.
Less than half of its tokens are in circulation. In terms of price to burn ratio, its figures suggest enormously inflated token prices: at 77 percent by circulating supply and a whopping 157 by total supply. That means it would take 157 years to burn all its tokens.
However, it does offer 30 percent discounts on trades for KCS holders and is only burning tokens at a rate of ten percent of net profit – a far less generous rate than other exchanges. Its aim is to burn half of its KCS supply, meaning a 77-year process at current revenue levels.
For some, the model may seem a more sensible approach to remaining profitable. But many traders would likely be attracted by having earnings shared more generously. Its tokenomic model may indicate why volumes are only a tenth of those on Huobi.
Bitfinex UNUS SED LEO
The controversial exchange released LEO tokens for a different reason than the other exchanges listed above. Having had assets of around $1 billion seized from its Panamanian banking partner Crypto Capital Corp, it launched the tokens to recover those losses.
Despite debatable beginnings, however, LEO tokens have been burning on target, returning funds to those who trusted the exchange sufficiently to prop it up through the token launch. All one billion of the UNUS SED LEO tokens issued will be destroyed on a monthly basis, using 27 percent of parent company iFinex’s gross revenues, according to the company’s Transparency Initiative. It will also use proceeds it recoups from Crypto Capital Corp to burn LEOs.
Given the circumstances under which they were issued, LEO token metrics produce potentially anomalous results. At a token value to volume ratio, LEO tokens are expensive at about 15. That also shows in its price to burn ratio of 55.
Further caution is warranted because of iFinex’s plans to buy back and burn all LEO tokens. Interesting economic models get produced when supply is known to eventually fall to zero. At press time, LEOs were trading for $1.02, having been issued for $1. They did, however, reach all-time highs of $2 at the end of June, a boon for those who bought them upon launch and sold at the right time.
Some Important Caveats
Whether coin burns have a marked impact on token prices is debatable. The results of these calculations require diligence when handling them, given that crypto price volatility can sometimes undo any effect a reduction in token supply should have on price. Having said that, major exchanges have undertaken to burn their tokens as planned and have not deviated from their stated targets, indicating good intentions.
At press time, Coinmarketcap was demonstrating unusual volume data for exchanges, potentially indicating a significant amount of wash trading was underway at some otherwise minor exchanges. Trading on BW was up 70 percent for the 24-hour period, for example, making it the number one exchange by adjusted volume. Binance was ranked 19th.
As Bitwise reported earlier this year, 95 percent of trading volume on unregulated exchanges was fake, with wash trading assumed to be responsible for large chunks of activity. The methodology used above was based on Coinmarketcap adjusted volume data.
A DYOR approach, as always, is necessary when it comes to crypto markets. While many of the metrics we found were consistent with other reputable data reporting, assumptions of data validity are only as strong as figures extracted from exchanges, many of which operate in a regulatory vacuum.
Tokenomics and utility both play a part in how exchange tokens are valued and priced. A good tokenomic strategy can be rendered useless if the tokens lack utility, just as tokens with a genuine purpose and use case will struggle to attract traders if the tokenomic model is unappealing.
Supply and demand dynamics in cryptocurrency markets remain very much a work in progress. As the industry matures, expect equilibrium prices to emerge that truly reflect a token’s worth. In the meantime, keeping an eye on exchange tokens and their performance in relation to the performance of the exchange is a worthwhile exercise.
