+17.8% (FY ended 2026-06-30 vs FY ended 2025-06-30) 10-K
Annual net income
133,749,000,000 USD (FY ended 2026-06-30, attributable to the company) 10-K
Annual operating margin
46.8% (FY ended 2026-06-30)
Forward P/E
Unavailable: no dated forecast source
Gloria daily close for session Oct 28, 2026. Market cap and trailing P/E use this close with the SEC share total and trailing diluted earnings, each dated next to its figure. Annual revenue, revenue growth, net income and margin show their own fiscal period and link the 10-K. Current context may postdate this article.
−162,502,000FY ended 2026-01-31, attributable to the company · 10-K
−6.1%FY ended 2026-01-31
Missing figures stay unavailable. Forward P/E requires a dated source. Annual revenue, revenue growth, net income and margin come from each company's own 10-K, in US dollars, and each row shows that fiscal year. Revenue growth compares the fiscal year with the prior year stated in the same 10-K. Net income is the full year amount attributable to the company, or available to common stockholders where the filing states only that, or consolidated net income. Each row names its basis. Trailing P/E reads "Not meaningful" when the dated trailing diluted EPS is a loss or zero. An operating margin appears only when the filing states both the operating income and the revenue for the same year.
Sources: SEC filings, Gloria daily closes and CoinGecko. Oldest record refresh: Oct 28, 2026, 5:41 PM EDT. Refresh is not a price or filing date. Each row shows its price date and its annual fiscal period. Peers use industry code and company size, or editorial selection. Market cap multiplies that row price by the company share total the latest SEC filing states for every share class together. Trailing P/E divides it by trailing diluted earnings from SEC filings. Rolled earnings per share are approximate because share counts can change between periods. Both appear only when the SEC data carries its date, so they are estimates at one price date, not synchronized filing valuations. Not investment advice.
Token vs underlying stock
Current comparison for MSFT. Historical observations may postdate this article.
Split-adjusted regular-session stock closes from the existing Gloria shared history, paired only with an observed token price within 45 minutes of 16:00 New York time. Up to 60 matched sessions. No interpolation or missing-date fill. Weekends and known early closes are omitted. Token units are not adjusted for issuer multipliers or dividend treatment. This compares quoted prices, not fair value, executable premiums or arbitrage returns. Solid line: token. Dashed line: stock. Exact quote times and values appear below. Historical observations. Retrieval refers to the token source. Token quote times use UTC. The fixed cohort shows its oldest member fetch.
Microsoft token vs Microsoft stock: exact source values
Date (UTC)
Token (USD)
Stock close (USD)
Token quote (UTC)
2026-08-05
484.73
487.46
2026-08-05 20:00
2026-08-06
498.48
499.86
2026-08-06 20:00
2026-08-07
501.35
499.99
2026-08-07 20:00
2026-08-10
507.81
506.06
2026-08-10 20:00
2026-08-11
503.83
503.81
2026-08-11 20:00
2026-08-12
493.50
492.43
2026-08-12 20:00
2026-08-13
494.66
496.88
2026-08-13 20:00
2026-08-14
496.96
495.40
2026-08-14 20:00
2026-08-17
481.91
480.35
2026-08-17 20:00
2026-08-18
482.93
481.63
2026-08-18 20:00
2026-08-19
484.48
484.31
2026-08-19 20:00
2026-08-20
482.95
481.15
2026-08-20 20:00
2026-08-21
485.28
483.24
2026-08-21 20:00
2026-08-24
489.80
487.31
2026-08-24 20:00
2026-08-25
491.36
491.71
2026-08-25 20:00
2026-08-26
498.86
496.37
2026-08-26 20:00
2026-08-27
506.15
505.06
2026-08-27 20:00
2026-08-28
514.87
513.53
2026-08-28 20:00
2026-08-31
510.07
507.29
2026-08-31 20:00
2026-09-01
503.61
501.02
2026-09-01 20:00
2026-09-02
497.76
496.82
2026-09-02 20:00
2026-09-03
512.63
510.12
2026-09-03 20:00
2026-09-04
500.58
499.70
2026-09-04 20:00
2026-09-08
493.27
493.95
2026-09-08 20:00
2026-09-09
491.69
491.65
2026-09-09 20:00
2026-09-10
493.07
492.44
2026-09-10 20:00
2026-09-11
498.52
495.63
2026-09-11 20:00
2026-09-14
508.54
505.41
2026-09-14 20:00
2026-09-15
498.86
497.12
2026-09-15 20:00
2026-09-16
494.48
490.30
2026-09-16 20:00
2026-09-17
500.28
497.75
2026-09-17 20:00
2026-09-18
496.33
493.78
2026-09-18 20:00
2026-09-21
503.22
501.61
2026-09-21 20:00
2026-09-22
501.25
498.00
2026-09-22 20:00
2026-09-23
503.06
500.59
2026-09-23 20:00
2026-09-24
501.07
497.93
2026-09-24 20:00
2026-09-25
518.98
516.17
2026-09-25 20:00
2026-09-28
511.70
509.22
2026-09-28 20:00
2026-09-29
512.06
508.96
2026-09-29 20:00
2026-09-30
515.27
512.90
2026-09-30 20:00
2026-10-01
516.84
512.80
2026-10-01 20:00
2026-10-02
519.95
517.53
2026-10-02 20:00
2026-10-05
527.35
525.18
2026-10-05 20:00
2026-10-06
532.35
529.30
2026-10-06 20:00
2026-10-07
532.01
529.76
2026-10-07 20:00
2026-10-08
525.93
522.61
2026-10-08 20:00
2026-10-09
537.45
535.07
2026-10-09 20:00
2026-10-12
543.48
541.15
2026-10-12 20:00
2026-10-13
546.06
543.45
2026-10-13 20:00
2026-10-14
535.70
533.69
2026-10-14 20:00
2026-10-15
542.43
539.44
2026-10-15 20:00
2026-10-16
531.87
529.05
2026-10-16 20:00
2026-10-19
535.69
533.52
2026-10-19 20:00
2026-10-20
535.30
531.87
2026-10-20 20:00
2026-10-21
535.87
532.95
2026-10-21 20:00
2026-10-22
524.11
521.08
2026-10-22 20:00
2026-10-23
525.75
524.51
2026-10-23 20:00
2026-10-26
534.07
532.60
2026-10-26 20:00
2026-10-27
533.36
531.33
2026-10-27 20:00
2026-10-28
533.14
531.01
2026-10-28 20:00
Stock history: Gloria · Retrieved Oct 29, 00:31 UTC. Token history: CoinGecko MSFTx.
Quoted token and share units can have different rights, multipliers and dividend treatment. This is not an executable premium or arbitrage signal.
Microsoft is slashing approximately 4,800 positions, roughly 2.1% of its global workforce, as the company undertakes a sweeping overhaul of its Xbox gaming division. The cuts, confirmed on July 6, represent the latest in a growing pattern of major tech firms trimming headcount in the name of AI-driven efficiency.
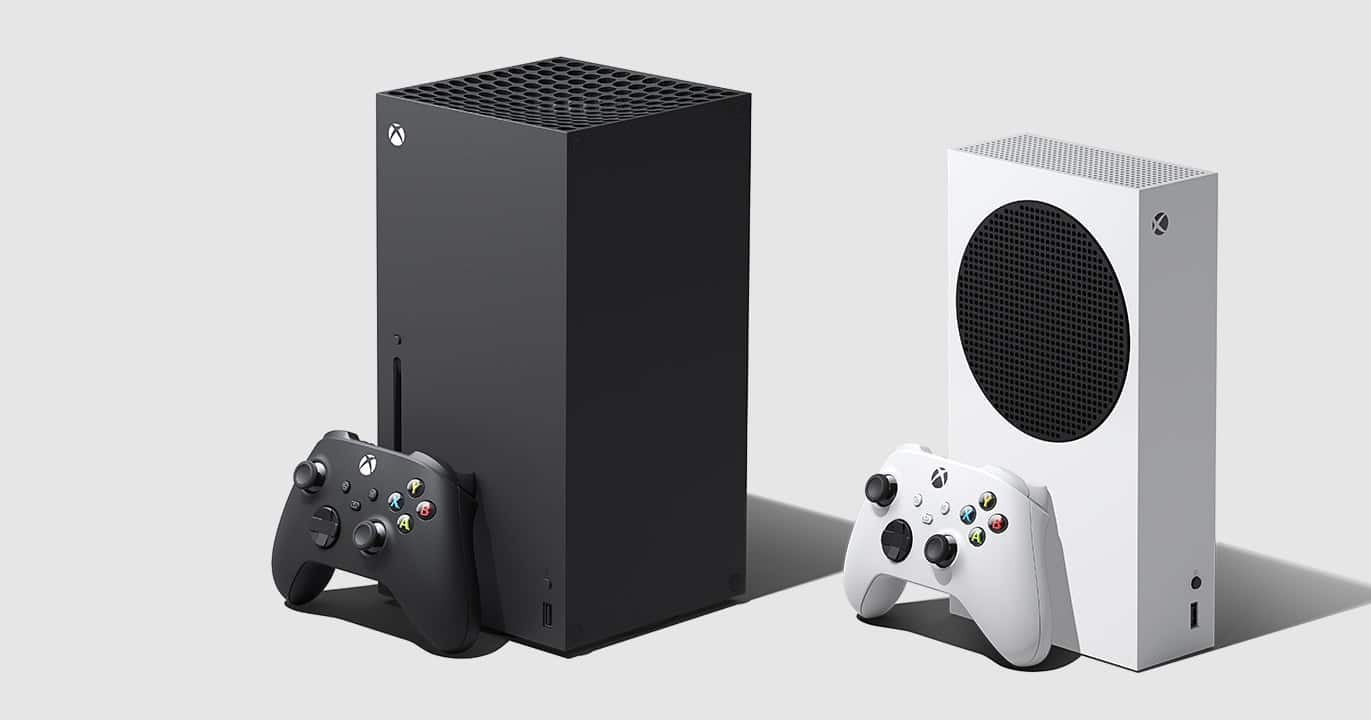
The Xbox division is absorbing a disproportionate share of the pain. Around 1,600 roles are currently affected within the gaming unit, with leadership indicating the division could lose approximately 20% of its staff by the close of the fiscal year. For a company that has spent over $20 billion on gaming acquisitions and content development over the past five years, that’s a remarkably blunt admission that the strategy hasn’t been paying off.
The Xbox problem
Xbox head Asha Sharma cited profit margins that had fallen to just 3%. Increased hardware costs and declining revenue trends have made the division’s current trajectory, in leadership’s own assessment, unsustainable.
The restructuring goes beyond just cutting heads. Microsoft plans to spin off or sell four development studios as part of the reset strategy.
Preliminary reports in early July had suggested the total damage could reach between 5,000 and 5,700 roles across Xbox and other areas of the company. The final number of 4,800 came in slightly below those early estimates.
AI, tech, and the markets they move—in one daily briefing.
Daily. Free. Join 34,000+ readers across crypto, finance, and policy.
Microsoft has been explicit that AI-related disruptions are contributing factors to the workforce reductions. The company has invested billions in its partnership with OpenAI and has been embedding AI capabilities across its product suite, from Copilot in Office to Azure AI services.
Microsoft itself cut 10,000 roles in January 2023 and another 1,900 gaming positions in early 2024 following its Activision Blizzard acquisition.
What this means for investors
Over $20 billion deployed into content and acquisitions over five years, only to arrive at 3% margins and a 20% staff reduction, is the kind of math that makes CFOs wince. Investors should watch closely whether the studio spin-offs or sales generate meaningful returns or amount to cutting losses on investments that didn’t pan out.
The pivot toward AI efficiency could ultimately be bullish for Microsoft’s stock if it means reallocating capital from low-margin gaming operations to higher-growth AI and cloud segments. Azure continues to be a growth engine, and the AI integration story gives Microsoft a narrative that Wall Street has been eager to reward.
Disclosure: This article was edited by Editorial Team. For more information on how we create and review content, see our Editorial Policy.