SpaceX executes massive IPO and explores merger with Tesla amid AI ambitions
SpaceX raised $75 billion at $135 per share on Nasdaq, briefly crossing a $2 trillion market cap before a sharp pullback triggered fresh questions about a potential Tesla merger
−2.9% (FY ended 2025-12-31 vs FY ended 2024-12-31) 10-K
Annual net income
3,794,000,000 USD (FY ended 2025-12-31, attributable to the company) 10-K
Annual operating margin
4.6% (FY ended 2025-12-31)
Forward P/E
Unavailable: no dated forecast source
Gloria daily close for session Oct 28, 2026. Market cap and trailing P/E use this close with the SEC share total and trailing diluted earnings, each dated next to its figure. Annual revenue, revenue growth, net income and margin show their own fiscal period and link the 10-K. Current context may postdate this article.
Tesla Inc. and its peers
Company
Price
Market cap
P/E (trailing)
Forward P/E
Annual revenue (USD)
Annual revenue growth
Annual net income (USD)
Operating margin
Tesla Inc.
TSLA · Price dated Oct 28, 2026 · tokenized TSLAx
−3,646,000,000FY ended 2025-12-31, attributable to the company · 10-K
−66.5%FY ended 2025-12-31
Missing figures stay unavailable. Forward P/E requires a dated source. Annual revenue, revenue growth, net income and margin come from each company's own 10-K, in US dollars, and each row shows that fiscal year. Revenue growth compares the fiscal year with the prior year stated in the same 10-K. Net income is the full year amount attributable to the company, or available to common stockholders where the filing states only that, or consolidated net income. Each row names its basis. Trailing P/E reads "Not meaningful" when the dated trailing diluted EPS is a loss or zero. An operating margin appears only when the filing states both the operating income and the revenue for the same year.
Sources: SEC filings, Gloria daily closes, CoinGecko and Databento. Oldest record refresh: Oct 28, 2026, 4:31 PM EDT. Refresh is not a price or filing date. Each row shows its price date and its annual fiscal period. Peers use industry code and company size, or editorial selection. Market cap multiplies that row price by the company share total the latest SEC filing states for every share class together. Trailing P/E divides it by trailing diluted earnings from SEC filings. Rolled earnings per share are approximate because share counts can change between periods. Both appear only when the SEC data carries its date, so they are estimates at one price date, not synchronized filing valuations. Not investment advice.
Token vs underlying stock
Current comparison for TSLA. Historical observations may postdate this article.
Split-adjusted regular-session stock closes from the existing Gloria shared history, paired only with an observed token price within 45 minutes of 16:00 New York time. Up to 60 matched sessions. No interpolation or missing-date fill. Weekends and known early closes are omitted. Token units are not adjusted for issuer multipliers or dividend treatment. This compares quoted prices, not fair value, executable premiums or arbitrage returns. Solid line: token. Dashed line: stock. Exact quote times and values appear below. Historical observations. Retrieval refers to the token source. Token quote times use UTC. The fixed cohort shows its oldest member fetch.
Tesla token vs Tesla stock: exact source values
Date (UTC)
Token (USD)
Stock close (USD)
Token quote (UTC)
2026-08-04
327.60
327.35
2026-08-04 20:00
2026-08-05
321.77
321.55
2026-08-05 20:00
2026-08-06
319.34
319.53
2026-08-06 20:00
2026-08-07
328.56
328.58
2026-08-07 20:00
2026-08-10
330.41
330.88
2026-08-10 20:00
2026-08-11
332.57
332.81
2026-08-11 20:00
2026-08-12
327.33
327.51
2026-08-12 20:00
2026-08-13
339.84
339.96
2026-08-13 20:00
2026-08-14
342.19
342.27
2026-08-14 20:00
2026-08-17
339.31
339.30
2026-08-17 20:00
2026-08-18
336.76
336.87
2026-08-18 20:00
2026-08-19
350.81
351.12
2026-08-19 20:00
2026-08-20
344.93
345.13
2026-08-20 20:00
2026-08-21
363.21
362.86
2026-08-21 20:00
2026-08-24
349.40
348.95
2026-08-24 20:00
2026-08-25
350.44
350.25
2026-08-25 20:00
2026-08-26
345.96
345.82
2026-08-26 20:00
2026-08-27
354.49
354.81
2026-08-27 20:00
2026-08-28
348.43
348.75
2026-08-28 20:00
2026-08-31
368.11
367.95
2026-08-31 20:00
2026-09-01
356.26
356.09
2026-09-01 20:00
2026-09-02
356.40
357.01
2026-09-02 20:00
2026-09-03
376.26
376.37
2026-09-03 20:00
2026-09-04
353.98
354.08
2026-09-04 20:00
2026-09-08
367.67
368.16
2026-09-08 20:00
2026-09-09
367.89
367.81
2026-09-09 20:00
2026-09-10
363.21
363.56
2026-09-10 20:00
2026-09-11
365.20
365.44
2026-09-11 20:00
2026-09-14
358.97
358.97
2026-09-14 20:00
2026-09-15
356.15
356.58
2026-09-15 20:00
2026-09-16
357.92
358.08
2026-09-16 20:00
2026-09-17
366.16
366.20
2026-09-17 20:00
2026-09-18
364.26
364.27
2026-09-18 20:00
2026-09-21
375.33
375.30
2026-09-21 20:00
2026-09-22
378.85
378.90
2026-09-22 20:00
2026-09-23
379.78
380.12
2026-09-23 20:00
2026-09-24
378.18
377.94
2026-09-24 20:00
2026-09-25
372.41
372.11
2026-09-25 20:00
2026-09-28
357.86
357.45
2026-09-28 20:00
2026-09-29
352.87
352.84
2026-09-29 20:00
2026-09-30
354.55
354.81
2026-09-30 20:00
2026-10-01
354.60
354.11
2026-10-01 20:00
2026-10-02
370.48
370.59
2026-10-02 20:00
2026-10-05
378.53
378.73
2026-10-05 20:00
2026-10-06
380.33
380.68
2026-10-06 20:00
2026-10-07
377.65
377.81
2026-10-07 20:00
2026-10-08
374.64
375.00
2026-10-08 20:00
2026-10-09
382.68
382.70
2026-10-09 20:00
2026-10-12
377.87
378.03
2026-10-12 20:00
2026-10-13
375.78
375.23
2026-10-13 20:00
2026-10-14
366.65
367.16
2026-10-14 20:00
2026-10-15
362.70
362.44
2026-10-15 20:00
2026-10-16
354.41
354.72
2026-10-16 20:00
2026-10-19
368.02
368.06
2026-10-19 20:00
2026-10-20
373.65
373.71
2026-10-20 20:00
2026-10-21
386.28
386.47
2026-10-21 20:00
2026-10-22
376.50
374.58
2026-10-22 20:00
2026-10-23
372.40
372.22
2026-10-23 20:00
2026-10-26
391.19
391.62
2026-10-26 20:00
2026-10-27
406.70
407.46
2026-10-27 20:00
Stock history: Gloria · Retrieved Oct 29, 00:32 UTC. Token history: CoinGecko TSLAx.
Quoted token and share units can have different rights, multipliers and dividend treatment. This is not an executable premium or arbitrage signal.
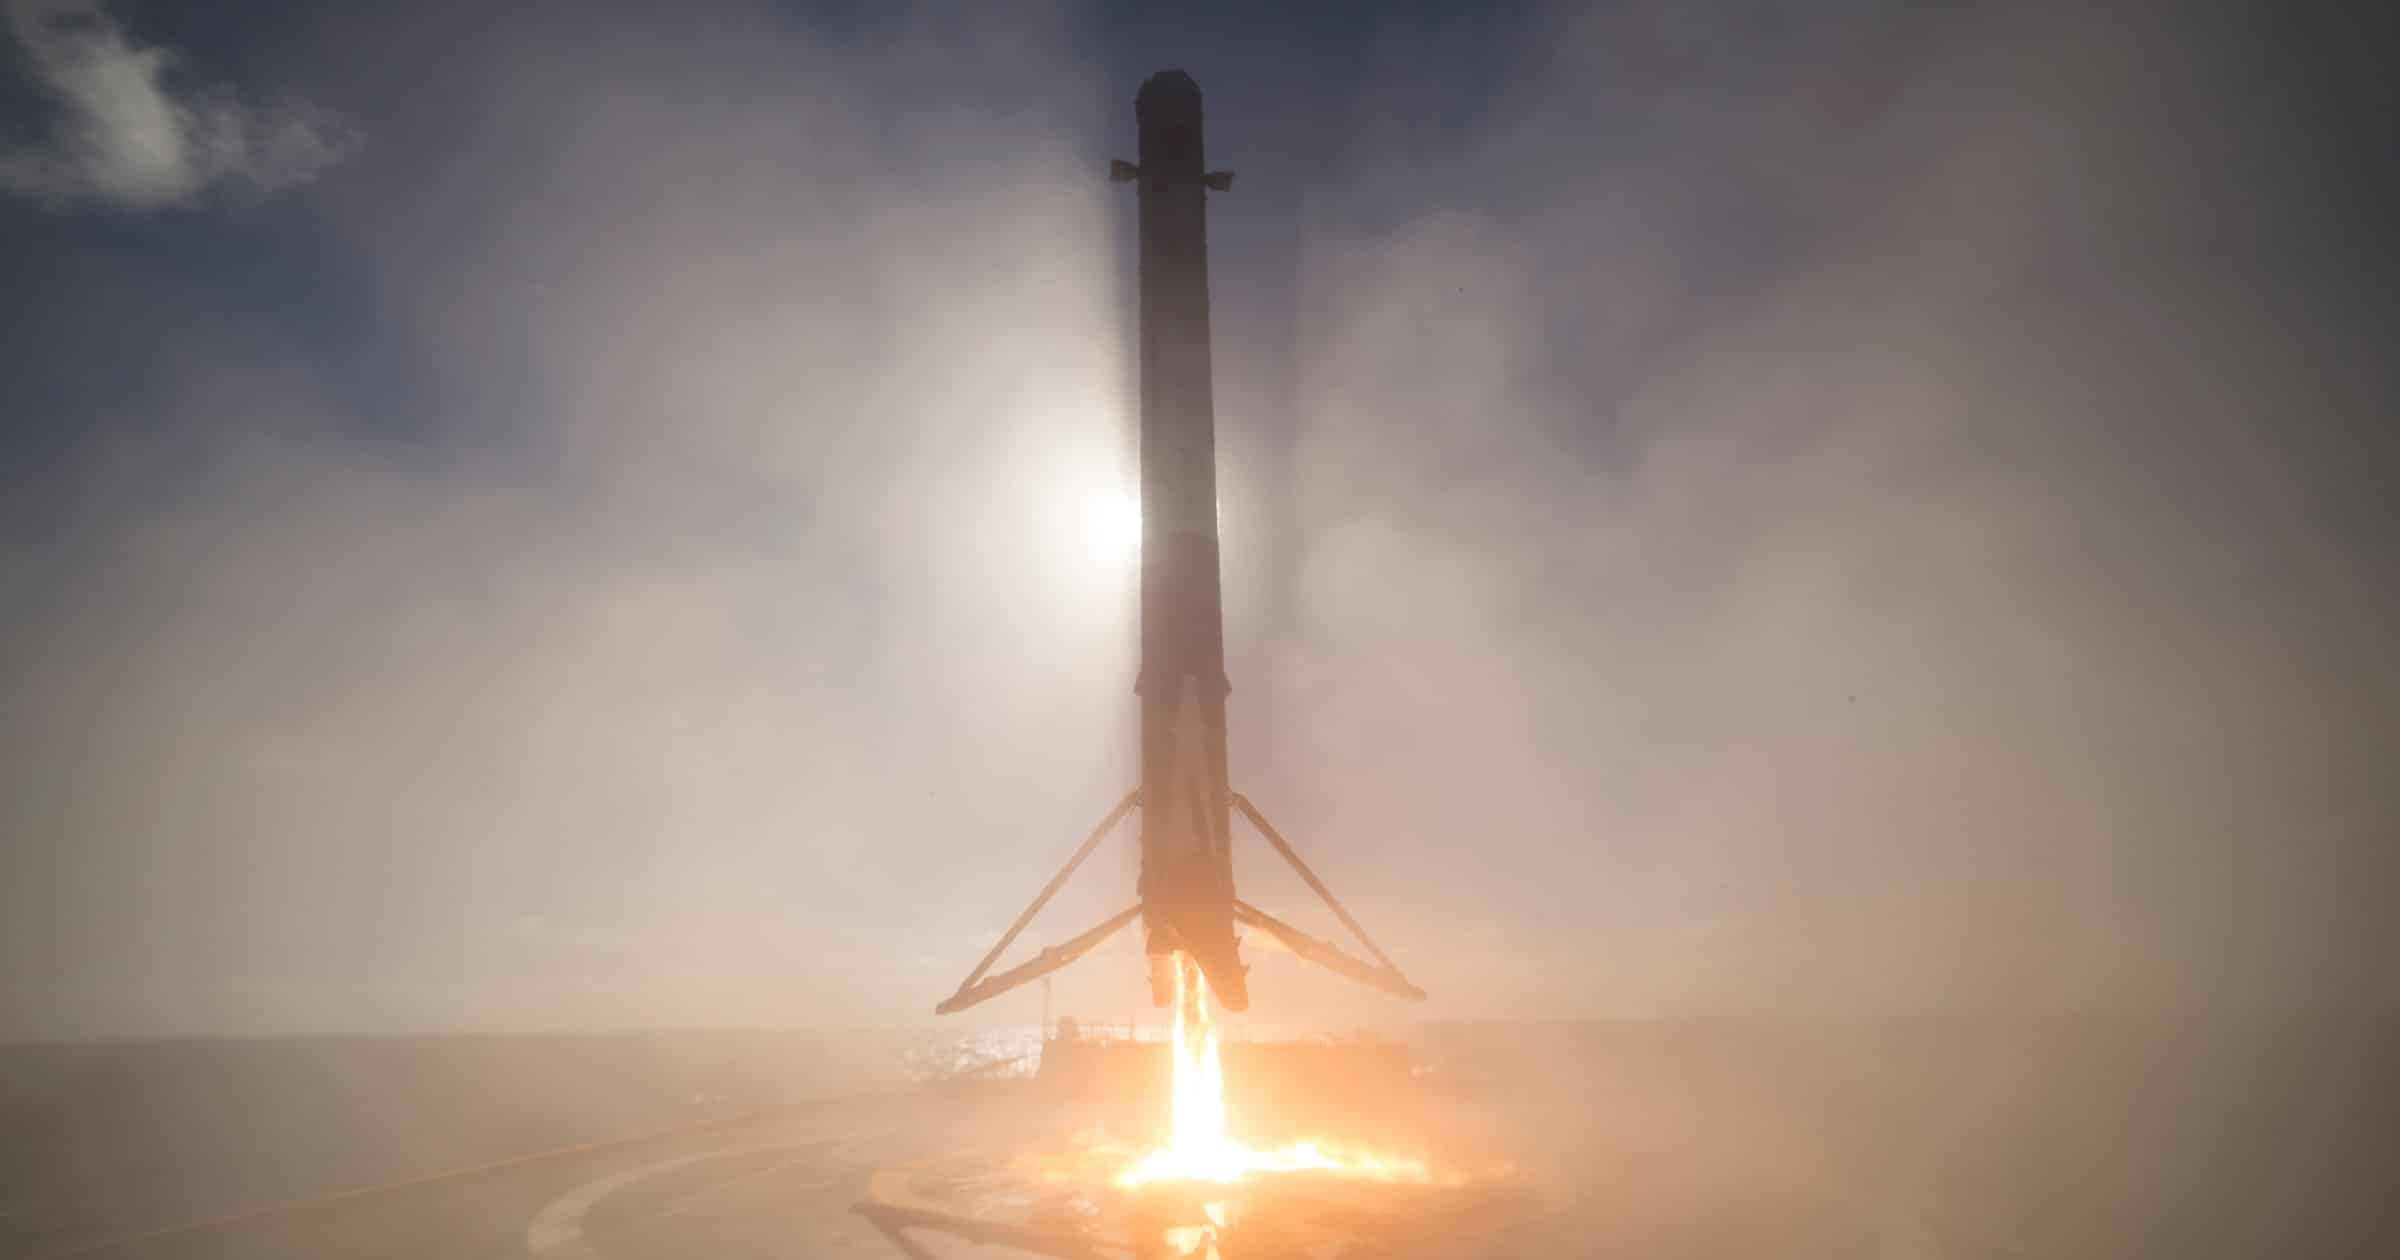
The world’s most anticipated private company finally went public, and it did not disappoint on the drama front. SpaceX priced its initial public offering at $135 per share on June 12, 2026, raising $75 billion in what stands as a record-breaking market debut. Underwriter options pushed that figure to $86 billion.
The Nasdaq listing under ticker SPCX gave SpaceX an opening valuation of roughly $1.77 trillion. Early trading sent shares surging toward $226, briefly pushing the market cap above $2 trillion before a pullback of up to 32% from those highs.
The AI engine underneath the rocket company
In early 2026, SpaceX acquired xAI, Elon Musk’s artificial intelligence venture, folding it into the broader corporate structure. The goal, according to the company, is to combine space infrastructure with AI-driven optimization, including managing energy consumption across operations.
Post-IPO, the conversation shifted quickly to a question that has been circulating in investment circles for months: could SpaceX and Tesla merge? SpaceX president Gwynne Shotwell added fuel to that speculation by publicly remarking on the potential benefits such a combination could offer Musk personally and operationally.
Analysts who have looked at the combined numbers suggest a merged entity could carry a valuation exceeding $3 trillion. The risks, though, are real and specific to Tesla. Tesla’s stock performance has been uneven, and absorbing its volatility into a newly public SpaceX could create complications for SPCX shareholders who bought in expecting a pure-play aerospace and AI story.
AI, tech, and the markets they move—in one daily briefing.
Daily. Free. Join 34,000+ readers across crypto, finance, and policy.
No formal offer has been made, no merger agreement has been signed, and both companies continue to operate independently.
What this means for investors watching from the crypto side
No digital assets were directly referenced during the IPO process or in the merger discussions, and there is no indication SpaceX is building a crypto treasury strategy the way some tech-adjacent companies have experimented with.
The 32% pullback from intraday highs on the first day of trading also tells a story. It suggests that even with record demand, the market is not writing blank checks for speculative tech stories right now.
Disclosure: This article was edited by Editorial Team. For more information on how we create and review content, see our Editorial Policy.