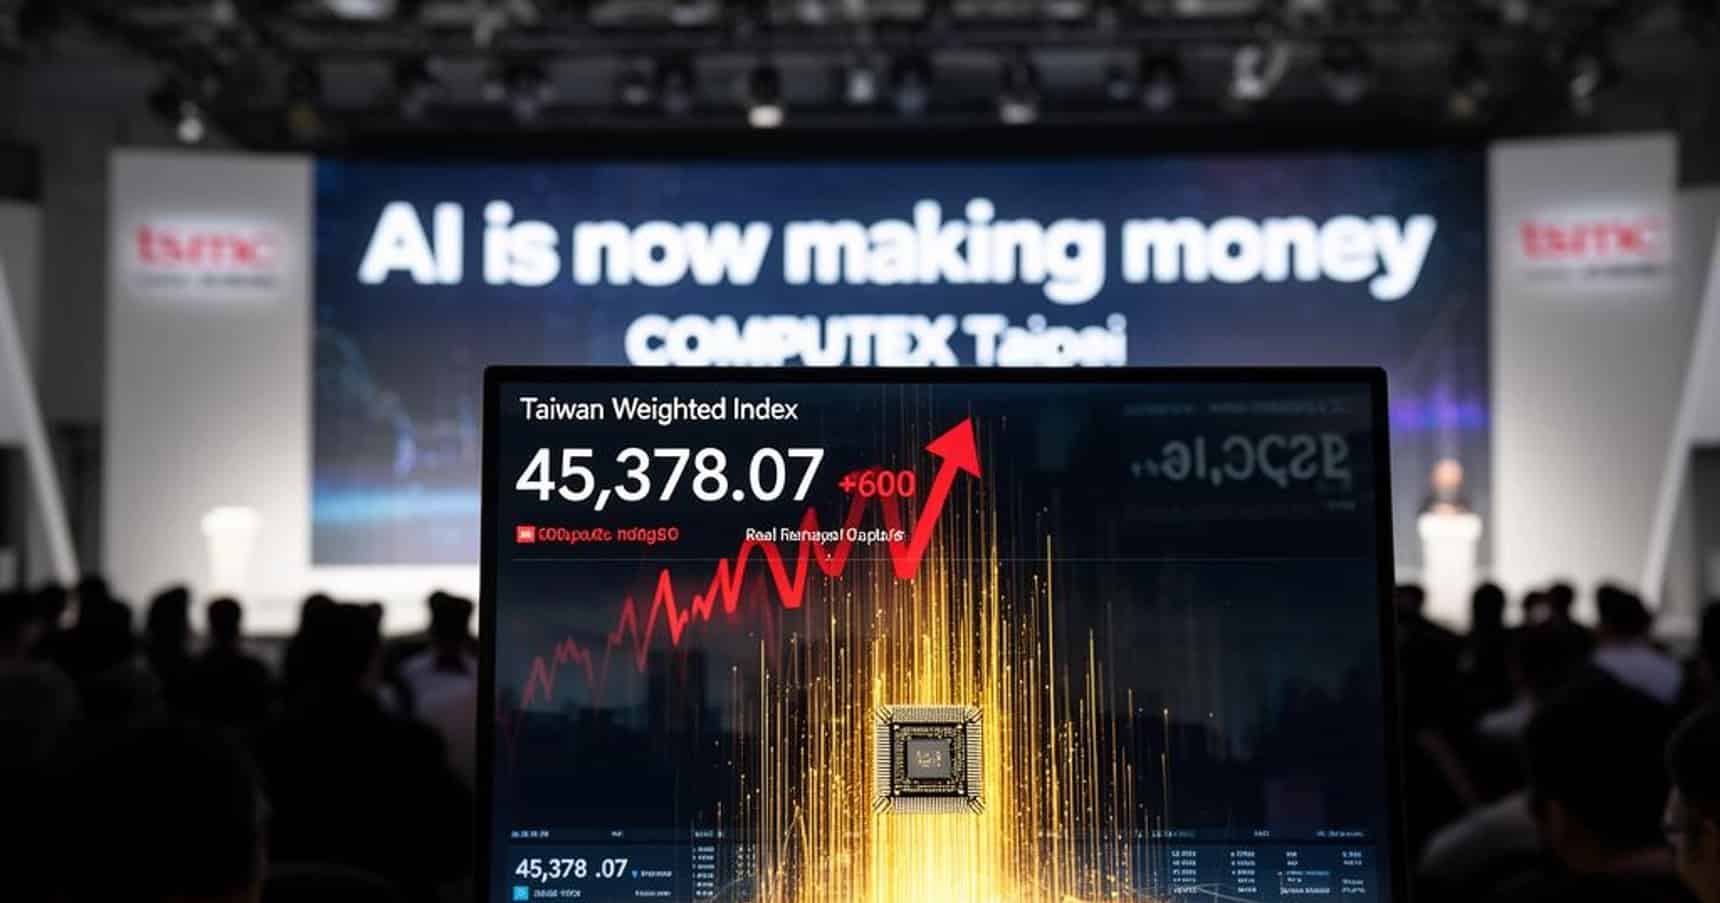
Taiwan Weighted Index surges nearly 1,630 points in a single session, gaining 3.78%
The TAIEX's massive Friday rally highlights the outsized influence of semiconductor giant TSMC and the increasingly volatile nature of Taiwan's equity market.
+65.5% (FY ended 2026-01-25 vs FY ended 2025-01-26) 10-K
Annual net income
120,067,000,000 USD (FY ended 2026-01-25, attributable to the company) 10-K
Annual operating margin
60.4% (FY ended 2026-01-25)
Forward P/E
Unavailable: no dated forecast source
Gloria daily close for session Oct 29, 2026. Market cap and trailing P/E use this close with the SEC share total and trailing diluted earnings, each dated next to its figure. Annual revenue, revenue growth, net income and margin show their own fiscal period and link the 10-K. Current context may postdate this article.
4,335,000,000FY ended 2025-12-27, attributable to the company · 10-K
10.7%FY ended 2025-12-27
Missing figures stay unavailable. Forward P/E requires a dated source. Annual revenue, revenue growth, net income and margin come from each company's own 10-K, in US dollars, and each row shows that fiscal year. Revenue growth compares the fiscal year with the prior year stated in the same 10-K. Net income is the full year amount attributable to the company, or available to common stockholders where the filing states only that, or consolidated net income. Each row names its basis. Trailing P/E reads "Not meaningful" when the dated trailing diluted EPS is a loss or zero. An operating margin appears only when the filing states both the operating income and the revenue for the same year.
Sources: SEC filings, Gloria daily closes and CoinGecko. Oldest record refresh: Oct 29, 2026, 1:52 PM EDT. Refresh is not a price or filing date. Each row shows its price date and its annual fiscal period. Peers use industry code and company size, or editorial selection. Market cap multiplies that row price by the company share total the latest SEC filing states for every share class together. Trailing P/E divides it by trailing diluted earnings from SEC filings. Rolled earnings per share are approximate because share counts can change between periods. Both appear only when the SEC data carries its date, so they are estimates at one price date, not synchronized filing valuations. Not investment advice.
Token vs underlying stock
Current comparison for NVDA. Historical observations may postdate this article.
Split-adjusted regular-session stock closes from the existing Gloria shared history, paired only with an observed token price within 45 minutes of 16:00 New York time. Up to 60 matched sessions. No interpolation or missing-date fill. Weekends and known early closes are omitted. Token units are not adjusted for issuer multipliers or dividend treatment. This compares quoted prices, not fair value, executable premiums or arbitrage returns. Solid line: token. Dashed line: stock. Exact quote times and values appear below. Historical observations. Retrieval refers to the token source. Token quote times use UTC. The fixed cohort shows its oldest member fetch.
Nvidia token vs Nvidia stock: exact source values
Date (UTC)
Token (USD)
Stock close (USD)
Token quote (UTC)
2026-08-06
219.15
218.99
2026-08-06 20:00
2026-08-07
223.93
223.96
2026-08-07 20:00
2026-08-10
217.66
217.55
2026-08-10 20:00
2026-08-11
217.53
217.50
2026-08-11 20:00
2026-08-12
224.12
224.09
2026-08-12 20:00
2026-08-13
225.42
225.30
2026-08-13 20:00
2026-08-14
225.34
225.16
2026-08-14 20:00
2026-08-17
225.13
225.01
2026-08-17 20:00
2026-08-18
219.70
219.74
2026-08-18 20:00
2026-08-19
217.76
217.56
2026-08-19 20:00
2026-08-20
216.79
216.85
2026-08-20 20:00
2026-08-21
214.85
214.72
2026-08-21 20:00
2026-08-24
208.75
208.48
2026-08-24 20:00
2026-08-25
213.16
213.05
2026-08-25 20:00
2026-08-26
210.06
209.66
2026-08-26 20:00
2026-08-27
227.96
227.98
2026-08-27 20:00
2026-08-28
217.74
217.55
2026-08-28 20:00
2026-08-31
220.91
220.78
2026-08-31 20:00
2026-09-01
217.58
217.44
2026-09-01 20:00
2026-09-02
224.46
224.41
2026-09-02 20:00
2026-09-03
228.90
228.45
2026-09-03 20:00
2026-09-04
230.35
230.36
2026-09-04 20:00
2026-09-08
225.69
225.73
2026-09-08 20:00
2026-09-09
223.89
223.67
2026-09-09 20:00
2026-09-10
218.70
218.36
2026-09-10 20:00
2026-09-11
218.92
218.29
2026-09-11 20:00
2026-09-14
211.47
210.96
2026-09-14 20:00
2026-09-15
212.34
212.17
2026-09-15 20:00
2026-09-16
214.25
213.90
2026-09-16 20:00
2026-09-17
219.68
219.34
2026-09-17 20:00
2026-09-18
222.24
222.27
2026-09-18 20:00
2026-09-21
227.69
227.38
2026-09-21 20:00
2026-09-22
229.20
228.87
2026-09-22 20:00
2026-09-23
225.44
225.51
2026-09-23 20:00
2026-09-24
224.87
224.58
2026-09-24 20:00
2026-09-25
225.29
225.07
2026-09-25 20:00
2026-09-28
228.97
228.86
2026-09-28 20:00
2026-09-29
227.95
227.21
2026-09-29 20:00
2026-09-30
229.85
228.38
2026-09-30 20:00
2026-10-01
231.18
230.86
2026-10-01 20:00
2026-10-02
234.38
233.95
2026-10-02 20:00
2026-10-05
239.30
238.90
2026-10-05 20:00
2026-10-06
239.71
239.24
2026-10-06 20:00
2026-10-07
237.80
237.47
2026-10-07 20:00
2026-10-08
230.81
230.48
2026-10-08 20:00
2026-10-09
229.70
229.28
2026-10-09 20:00
2026-10-12
226.87
226.32
2026-10-12 20:00
2026-10-13
228.73
228.52
2026-10-13 20:00
2026-10-14
221.56
221.30
2026-10-14 20:00
2026-10-15
217.48
217.23
2026-10-15 20:00
2026-10-16
214.56
214.13
2026-10-16 20:00
2026-10-19
217.41
217.09
2026-10-19 20:00
2026-10-20
216.69
216.47
2026-10-20 20:00
2026-10-21
222.20
221.97
2026-10-21 20:00
2026-10-22
212.42
212.21
2026-10-22 20:00
2026-10-23
211.27
210.96
2026-10-23 20:00
2026-10-26
216.15
216.00
2026-10-26 20:00
2026-10-27
218.06
217.94
2026-10-27 20:00
2026-10-28
215.40
215.38
2026-10-28 20:00
2026-10-29
213.57
213.66
2026-10-29 20:00
Stock history: Gloria · Retrieved Oct 30, 00:32 UTC. Token history: CoinGecko NVDAx.
Quoted token and share units can have different rights, multipliers and dividend treatment. This is not an executable premium or arbitrage signal.
Taiwan’s benchmark stock index ripped higher on Friday, adding 1,629.17 points to close at 44,778.63. That’s a 3.78% single-session gain.
No single geopolitical event or regulatory announcement has been identified as the catalyst. The rally appears to reflect broader momentum in the semiconductor sector and a rebound from recent selling pressure, including a 1,568-point drop just days earlier on June 9.
TSMC: the index within the index
To understand the TAIEX, you have to understand one company. Taiwan Semiconductor Manufacturing Co. represents approximately 44% of the entire index. That’s not a typo. One company, nearly half the weight.
The global appetite for artificial intelligence infrastructure has been relentless throughout 2026, and TSMC sits at the center of that supply chain. The company fabricates chips for virtually every major AI player, from Nvidia to Apple, making it one of the most strategically important businesses on the planet. That demand has propelled both TSMC’s stock and the broader TAIEX to multiple record highs this year, with the index exceeding 46,000 points at its peak.
Friday’s close at 44,778.63 means the index is still trading below those highs. Losing 1,568 points one week and gaining 1,629 points the next reflects the acute volatility created by this concentration.
A market that doubled since 2020
Taiwan’s stock market has undergone a dramatic transformation over the past six years. The total market capitalization of Taiwan’s exchanges has surged past $4.4 trillion to $4.9 trillion in 2026, ranking the island’s equity market among the top five to seven globally.
AI, tech, and the markets they move—in one daily briefing.
Daily. Free. Join 34,000+ readers across crypto, finance, and policy.
The market has essentially doubled in value since 2020, fueled by foreign capital inflows, regulatory easements that made it simpler for international investors to participate, and the once-in-a-generation boom in semiconductor demand driven by AI.
When roughly 44% of your index is a single stock, you’re not really buying diversified exposure to the Taiwanese economy. That dynamic explains why the TAIEX can swing more than 1,500 points in a single session, both up and down, within the span of a week.
What this means for investors
A market that can lose 3.48% on June 9 and gain 3.78% on a subsequent session is not exhibiting the behavior of a stable, mature equity environment.
Those external forces include US tech market sentiment, which has an outsized influence on TSMC’s valuation and, by extension, the entire TAIEX. When Nvidia or other major US tech names rally, the effect cascades directly into Taipei trading the following morning. When they sell off, the same mechanism works in reverse.
Geopolitical risk also looms constantly over Taiwan’s markets. Cross-strait tensions with China remain an ever-present backdrop, and any escalation, real or perceived, tends to trigger sharp selloffs.
Taiwan’s equity market has become one of the most important in the world almost entirely because of one company’s dominance in AI chip manufacturing. That makes the TAIEX one of the purest plays on the AI trade available in global equities, but it also makes it one of the most volatile major indices on earth. Friday’s 1,629-point surge was impressive, but moves of this magnitude in either direction have become routine.
Disclosure: This article was edited by Editorial Team. For more information on how we create and review content, see our Editorial Policy.