Skip to content
Advertisement
Adobe beats Q2 earnings expectations, announces CFO departure

Adobe beats Q2 earnings expectations, announces CFO departure

The creative software giant delivered stronger-than-expected revenue and earnings while revealing that CFO Dan Durn will exit in June

Adobe just posted fiscal Q2 2026 results that cleared Wall Street’s bar on revenue, earnings per share, and operating income. The company also issued upbeat guidance for both Q3 and the full fiscal year.

The “mostly” part: CFO Dan Durn is leaving the company in June. That’s a notable exit at a time when Adobe is navigating one of the rockier stretches in its recent history, with shares down roughly 37% year-to-date heading into the report.

The numbers that matter

Adobe had set its own Q2 guidance at $6.43 to $6.48 billion in revenue and non-GAAP EPS of $5.80 to $5.85. The company beat on both counts, along with operating income.

Advertisement

For context, Adobe’s Q1 FY2026 revenue came in at $6.40 billion, representing 12% year-over-year growth, with non-GAAP EPS of $6.06. That Q1 print had already topped consensus estimates hovering around $5.87 to $5.88 per share.

The company has been running non-GAAP operating margins in the 44% to 47% range in recent quarters.

Leadership turnover at a precarious moment

Durn joined Adobe in October 2021. His exit comes just months after CEO Shantanu Narayen announced in March 2026 that he would step down after 18 years leading the company. Narayen plans to remain as chair during the transition.

Durn is expected to participate in the earnings call, which should provide some clarity on succession planning.

The AI problem that earnings can’t solve

Adobe’s 37% stock decline in 2026 has been attributed to concerns over whether the company can defend its creative software franchise against AI-native competitors. Adobe has responded with Firefly, its own generative AI model, and has been weaving AI capabilities across its product suite.

Adobe’s annual recurring revenue growth target of approximately 10.2% for the full year suggests management isn’t seeing meaningful churn in the subscription base. Adobe’s ongoing share buyback program and non-GAAP operating margins in the 44% to 47% range give it financial flexibility to invest in AI without sacrificing earnings quality.
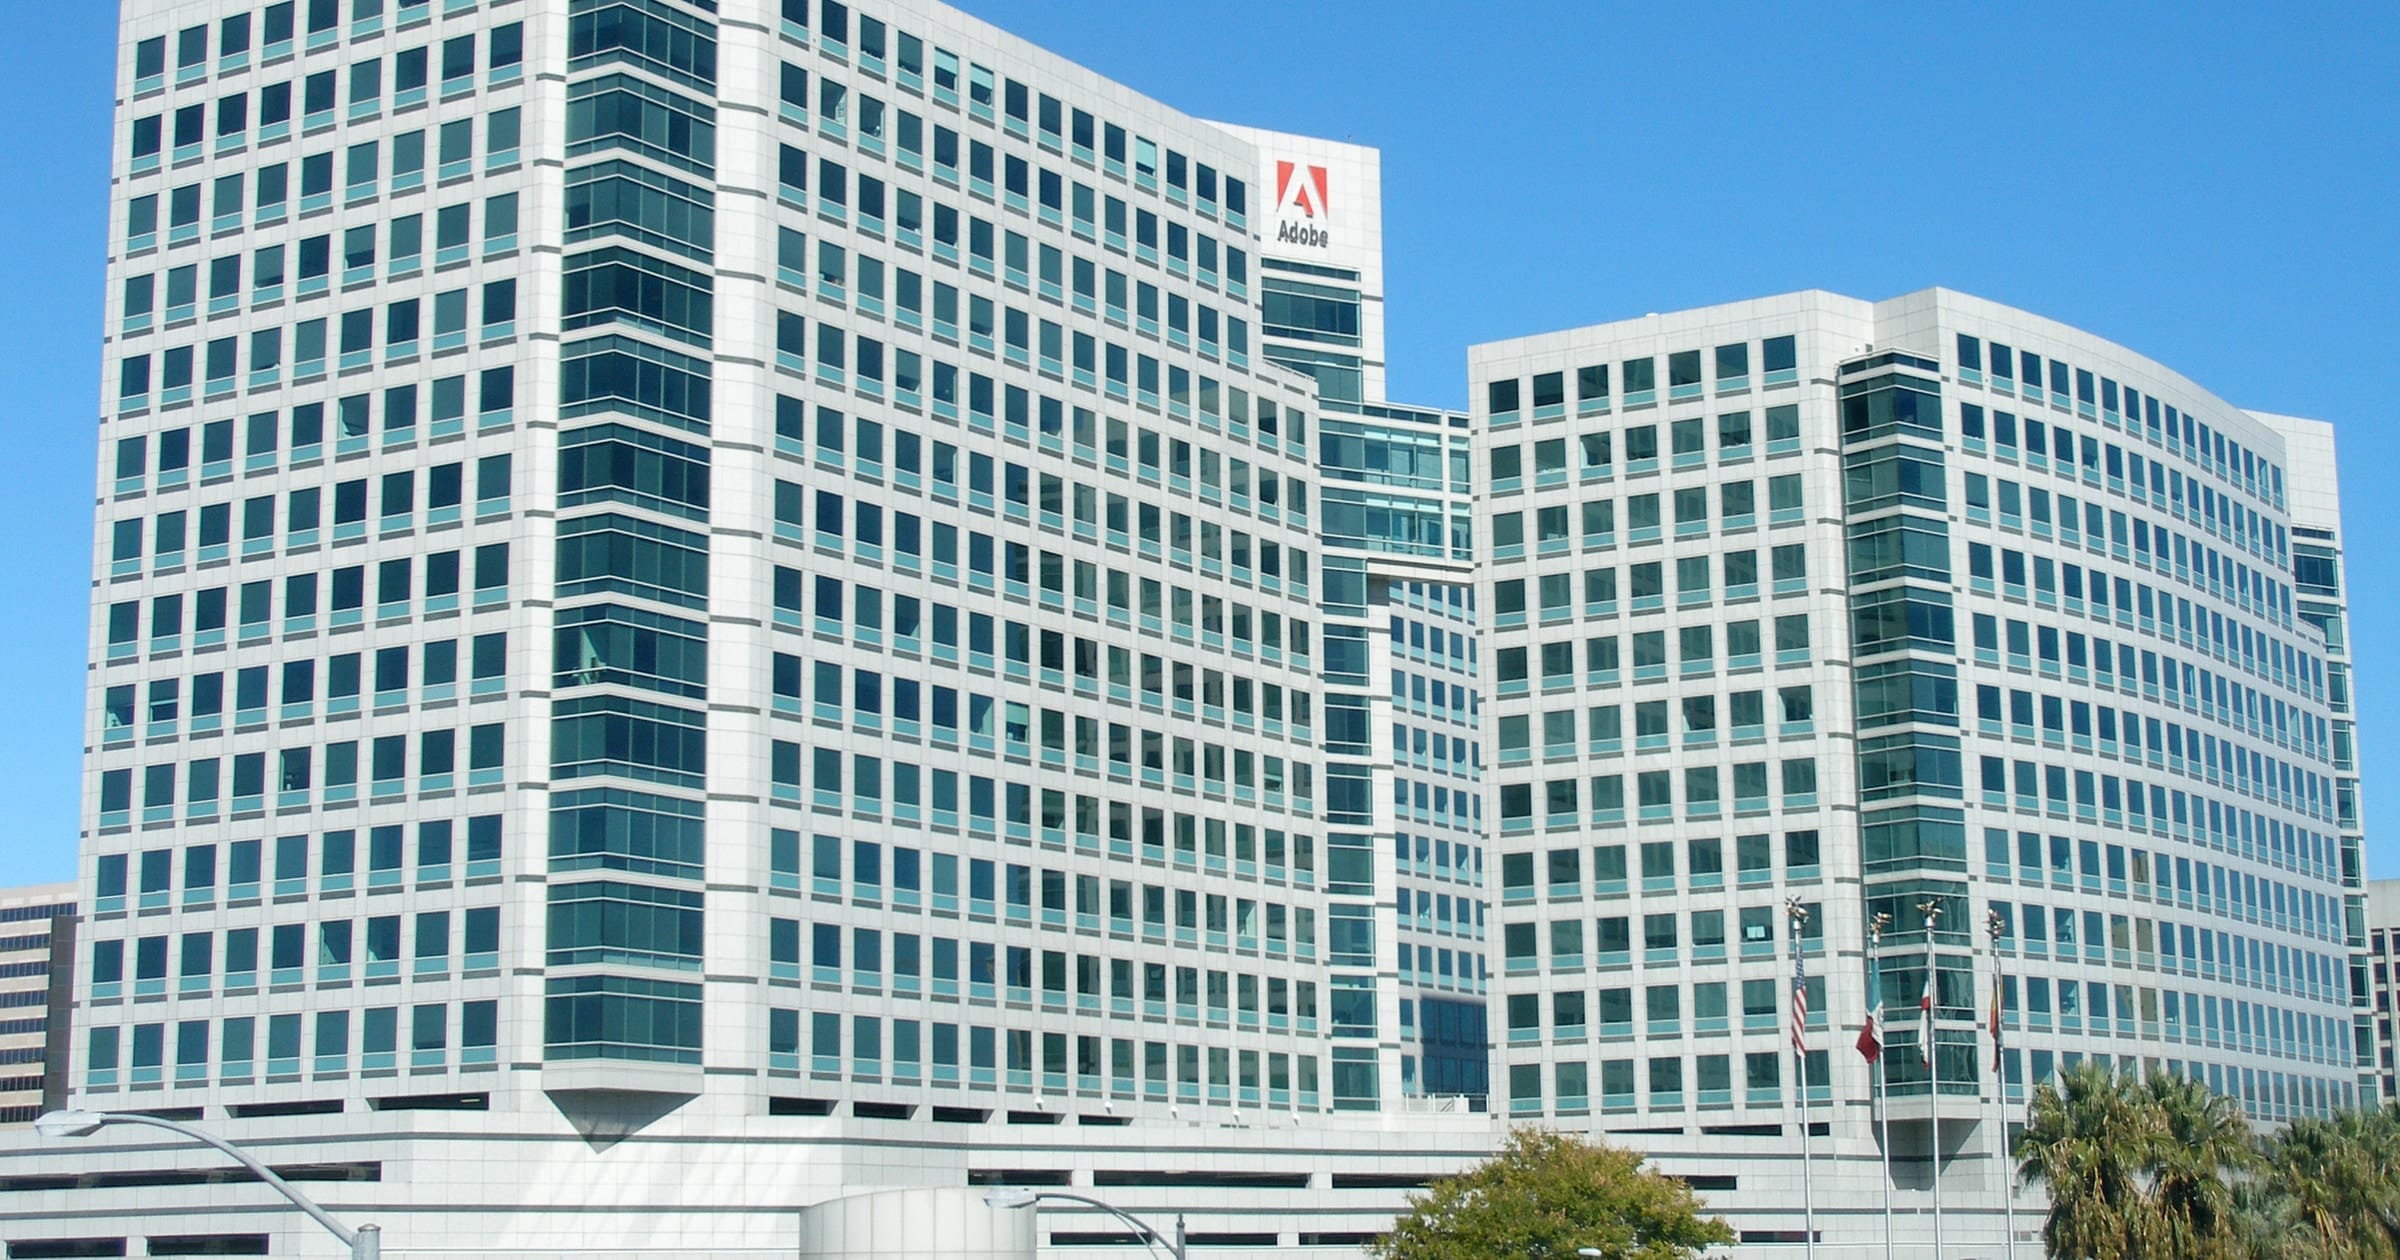
Adobe Inc. and its peers

Company PriceMarket capP/E (trailing)Forward P/EAnnual revenue (USD)Annual revenue growthAnnual net income (USD)Operating margin
Adobe Inc. ADBE · Price dated Nov 6, 2026 · tokenized ADBEx $239$93.1B13.4Unavailable$23.8BFY ended 2025-11-28 · 10-K+10.5%FY ended 2025-11-28 vs 2024-11-29 · 10-K7,130,000,000FY ended 2025-11-28, attributable to the company · 10-K36.6%FY ended 2025-11-28
Intuit Inc. INTU · Price dated Nov 6, 2026 $342$91.3B20.7Unavailable$21.4BFY ended 2026-07-31 · 10-K+13.9%FY ended 2026-07-31 vs 2025-07-31 · 10-K4,566,000,000FY ended 2026-07-31, attributable to the company · 10-K27.4%FY ended 2026-07-31
Cadence Design Systems Inc. CDNS · Price dated Nov 6, 2026 $320$87.8B63.6Unavailable$5.3BFY ended 2025-12-31 · 10-K+14.1%FY ended 2025-12-31 vs 2024-12-31 · 10-K1,108,888,000FY ended 2025-12-31, attributable to the company · 10-K28.2%FY ended 2025-12-31
Synopsys Inc. SNPS · Price dated Nov 6, 2026 $450$86.3B78.8Unavailable$7.1BFY ended 2025-10-31 · 10-K+15.1%FY ended 2025-10-31 vs 2024-10-31 · 10-K1,332,220,000FY ended 2025-10-31, attributable to the company · 10-K13.0%FY ended 2025-10-31

Missing figures stay unavailable. Forward P/E requires a dated source. Annual revenue, revenue growth, net income and margin come from each company's own 10-K, in US dollars, and each row shows that fiscal year. Revenue growth compares the fiscal year with the prior year stated in the same 10-K. Net income is the full year amount attributable to the company, or available to common stockholders where the filing states only that, or consolidated net income. Each row names its basis. Trailing P/E reads "Not meaningful" when the dated trailing diluted EPS is a loss or zero. An operating margin appears only when the filing states both the operating income and the revenue for the same year.

Sources: SEC filings, Gloria daily closes and CoinGecko. Oldest record refresh: Nov 7, 2026, 4:56 PM EST. Refresh is not a price or filing date. Each row shows its price date and its annual fiscal period. Peers use industry code and company size, or editorial selection. Market cap multiplies that row price by the company share total the latest SEC filing states for every share class together. Trailing P/E divides it by trailing diluted earnings from SEC filings. Rolled earnings per share are approximate because share counts can change between periods. Both appear only when the SEC data carries its date, so they are estimates at one price date, not synchronized filing valuations. Not investment advice.

Disclosure: This article was edited by Editorial Team. For more information on how we create and review content, see our Editorial Policy.

