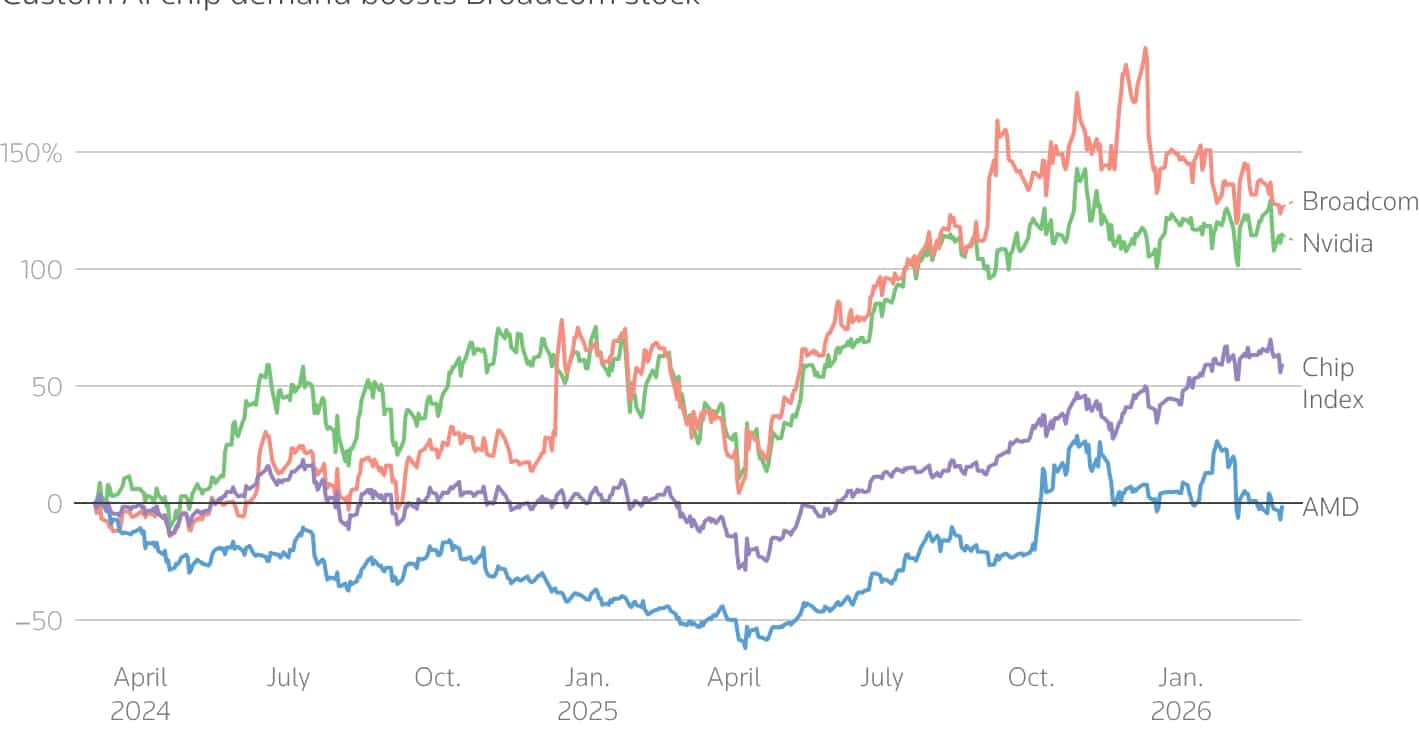
Apple’s $30B Broadcom deal is the biggest bet yet on American chip-making
A multiyear agreement extending through 2031 will produce over 15 billion US-made chips and anchor Broadcom's Colorado factory as a domestic semiconductor hub.
+6.4% (FY ended 2025-09-27 vs FY ended 2024-09-28) 10-K
Annual net income
112,010,000,000 USD (FY ended 2025-09-27, attributable to the company) 10-K
Annual operating margin
32.0% (FY ended 2025-09-27)
Forward P/E
Unavailable: no dated forecast source
Gloria daily close for session Oct 28, 2026. Market cap and trailing P/E use this close with the SEC share total and trailing diluted earnings, each dated next to its figure. Annual revenue, revenue growth, net income and margin show their own fiscal period and link the 10-K. Current context may postdate this article.
Apple Inc. and its peers
Company
Price
Market cap
P/E (trailing)
Forward P/E
Annual revenue (USD)
Annual revenue growth
Annual net income (USD)
Operating margin
Apple Inc.
AAPL · Price dated Oct 28, 2026 · tokenized AAPLx
13,267,000,000FY ended 2026-07-25, attributable to the company · 10-K
24.3%FY ended 2026-07-25
Missing figures stay unavailable. Forward P/E requires a dated source. Annual revenue, revenue growth, net income and margin come from each company's own 10-K, in US dollars, and each row shows that fiscal year. Revenue growth compares the fiscal year with the prior year stated in the same 10-K. Net income is the full year amount attributable to the company, or available to common stockholders where the filing states only that, or consolidated net income. Each row names its basis. Trailing P/E reads "Not meaningful" when the dated trailing diluted EPS is a loss or zero. An operating margin appears only when the filing states both the operating income and the revenue for the same year.
Sources: SEC filings, Gloria daily closes and CoinGecko. Oldest record refresh: Oct 28, 2026, 6:21 PM EDT. Refresh is not a price or filing date. Each row shows its price date and its annual fiscal period. Peers use industry code and company size, or editorial selection. Market cap multiplies that row price by the company share total the latest SEC filing states for every share class together. Trailing P/E divides it by trailing diluted earnings from SEC filings. Rolled earnings per share are approximate because share counts can change between periods. Both appear only when the SEC data carries its date, so they are estimates at one price date, not synchronized filing valuations. Not investment advice.
Token vs underlying stock
Current comparison for AAPL. Historical observations may postdate this article.
Split-adjusted regular-session stock closes from the existing Gloria shared history, paired only with an observed token price within 45 minutes of 16:00 New York time. Up to 60 matched sessions. No interpolation or missing-date fill. Weekends and known early closes are omitted. Token units are not adjusted for issuer multipliers or dividend treatment. This compares quoted prices, not fair value, executable premiums or arbitrage returns. Solid line: token. Dashed line: stock. Exact quote times and values appear below. Historical observations. Retrieval refers to the token source. Token quote times use UTC. The fixed cohort shows its oldest member fetch.
Apple token vs Apple stock: exact source values
Date (UTC)
Token (USD)
Stock close (USD)
Token quote (UTC)
2026-08-05
311.72
311.00
2026-08-05 20:00
2026-08-06
312.78
312.41
2026-08-06 20:00
2026-08-07
313.83
313.33
2026-08-07 20:00
2026-08-10
308.62
308.26
2026-08-10 20:00
2026-08-11
305.37
304.91
2026-08-11 20:00
2026-08-12
302.83
302.25
2026-08-12 20:00
2026-08-13
305.79
305.26
2026-08-13 20:00
2026-08-14
306.96
305.93
2026-08-14 20:00
2026-08-17
306.25
305.59
2026-08-17 20:00
2026-08-18
311.31
310.03
2026-08-18 20:00
2026-08-19
317.34
316.83
2026-08-19 20:00
2026-08-20
311.74
311.30
2026-08-20 20:00
2026-08-21
310.51
309.35
2026-08-21 20:00
2026-08-24
311.44
310.34
2026-08-24 20:00
2026-08-25
310.87
309.90
2026-08-25 20:00
2026-08-26
314.52
313.45
2026-08-26 20:00
2026-08-27
315.05
314.58
2026-08-27 20:00
2026-08-28
320.36
319.70
2026-08-28 20:00
2026-08-31
317.65
316.85
2026-08-31 20:00
2026-09-01
325.59
325.13
2026-09-01 20:00
2026-09-02
325.80
324.96
2026-09-02 20:00
2026-09-03
329.13
328.21
2026-09-03 20:00
2026-09-04
321.11
319.97
2026-09-04 20:00
2026-09-08
316.85
316.22
2026-09-08 20:00
2026-09-09
316.30
315.34
2026-09-09 20:00
2026-09-10
327.20
326.57
2026-09-10 20:00
2026-09-11
333.36
332.27
2026-09-11 20:00
2026-09-14
334.25
333.08
2026-09-14 20:00
2026-09-15
331.88
331.34
2026-09-15 20:00
2026-09-16
333.36
332.41
2026-09-16 20:00
2026-09-17
337.97
337.00
2026-09-17 20:00
2026-09-18
337.26
336.13
2026-09-18 20:00
2026-09-21
340.11
338.98
2026-09-21 20:00
2026-09-22
340.64
339.75
2026-09-22 20:00
2026-09-23
337.57
337.02
2026-09-23 20:00
2026-09-24
337.27
335.92
2026-09-24 20:00
2026-09-25
341.92
341.07
2026-09-25 20:00
2026-09-28
339.71
338.40
2026-09-28 20:00
2026-09-29
330.45
329.40
2026-09-29 20:00
2026-09-30
334.56
333.02
2026-09-30 20:00
2026-10-01
331.46
330.32
2026-10-01 20:00
2026-10-02
334.68
333.69
2026-10-02 20:00
2026-10-05
333.54
332.89
2026-10-05 20:00
2026-10-06
334.55
333.63
2026-10-06 20:00
2026-10-07
337.28
336.67
2026-10-07 20:00
2026-10-08
341.31
340.42
2026-10-08 20:00
2026-10-09
337.58
336.64
2026-10-09 20:00
2026-10-12
341.95
340.97
2026-10-12 20:00
2026-10-13
342.44
341.27
2026-10-13 20:00
2026-10-14
344.06
342.96
2026-10-14 20:00
2026-10-15
343.24
342.00
2026-10-15 20:00
2026-10-16
344.31
343.46
2026-10-16 20:00
2026-10-19
344.18
342.94
2026-10-19 20:00
2026-10-20
340.65
339.50
2026-10-20 20:00
2026-10-21
344.81
343.99
2026-10-21 20:00
2026-10-22
349.21
348.22
2026-10-22 20:00
2026-10-23
348.46
347.73
2026-10-23 20:00
2026-10-26
344.87
343.91
2026-10-26 20:00
2026-10-27
348.00
347.10
2026-10-27 20:00
2026-10-28
345.12
343.83
2026-10-28 20:00
Stock history: Gloria · Retrieved Oct 29, 00:31 UTC. Token history: CoinGecko AAPLx.
Quoted token and share units can have different rights, multipliers and dividend treatment. This is not an executable premium or arbitrage signal.
Apple has never been shy about writing large checks. But a commitment exceeding $30 billion to chip supplier Broadcom, announced July 8, 2026, lands in a different category entirely. It is the single largest commitment Apple has made under its American Manufacturing Program, and it is a signal that the company is treating domestic semiconductor supply as a genuine strategic priority, not a PR exercise.
The deal runs through 2031 and covers custom silicon components alongside advanced wireless connectivity technologies destined for several future generations of Apple products. In plain terms: the chips that will power future iPhones, iPads, and whatever Apple has cooking beyond that will increasingly be made on American soil.
What the deal actually covers
The partnership targets production of more than 15 billion US-made chips over its lifespan. Broadcom is putting $1.5 billion of its own capital into expanding and modernizing its manufacturing facility in Fort Collins, Colorado. The Fort Collins site will concentrate on radio frequency components, specifically FBAR filters and wireless connectivity technologies. FBAR filters manage signal clarity in wireless communications, and their performance directly affects how well a phone connects to cellular and Wi-Fi networks.
Broadcom President and CEO Hock Tan underscored the importance of the expanded Fort Collins footprint for meeting Apple’s production targets. The facility expansion is expected to support hundreds of American manufacturing jobs, though Apple did not provide a precise headcount figure in the announcement.
An earlier multibillion-dollar agreement signed in 2023 already covered 5G radio frequency components produced domestically. This new commitment builds on that foundation, extends the timeline significantly, and adds custom application-specific integrated circuit silicon, known as ASIC chips, to the scope. ASIC chips are designed for a single purpose rather than general computing, which makes them faster and more power-efficient for specific tasks.
AI, tech, and the markets they move—in one daily briefing.
Daily. Free. Join 34,000+ readers across crypto, finance, and policy.
The bigger picture: Apple’s $600B US manufacturing pledge
Apple launched its American Manufacturing Program in 2025 with a headline pledge of $600 billion in US investments over four years. The Broadcom deal, at more than $30 billion, represents a meaningful chunk of that total. Apple explicitly credited the Trump administration’s support in helping establish the manufacturing initiative.
What this means for investors watching both stocks
For anyone holding Broadcom stock, a guaranteed revenue stream exceeding $30 billion from Apple across five years is about as close to a locked-in growth catalyst as a semiconductor company can get. Broadcom already counts Apple as one of its most significant customers, and this agreement deepens that dependency in both directions. Apple needs the chips; Broadcom needs the volume to justify a $1.5 billion factory expansion.
For Apple specifically, the strategic read is about supply chain resilience and regulatory positioning rather than near-term margin improvement. Domestic chip production is not cheaper than Asian alternatives in most cases. Apple is accepting some cost in exchange for supply certainty, geopolitical insulation, and goodwill with a US government that has shown it is willing to use trade policy as leverage against the technology sector.
Disclosure: This article was edited by Editorial Team. For more information on how we create and review content, see our Editorial Policy.