+65.5% (FY ended 2026-01-25 vs FY ended 2025-01-26) 10-K
Annual net income
120,067,000,000 USD (FY ended 2026-01-25, attributable to the company) 10-K
Annual operating margin
60.4% (FY ended 2026-01-25)
Forward P/E
Unavailable: no dated forecast source
Gloria daily close for session Oct 29, 2026. Market cap and trailing P/E use this close with the SEC share total and trailing diluted earnings, each dated next to its figure. Annual revenue, revenue growth, net income and margin show their own fiscal period and link the 10-K. Current context may postdate this article.
4,335,000,000FY ended 2025-12-27, attributable to the company · 10-K
10.7%FY ended 2025-12-27
Missing figures stay unavailable. Forward P/E requires a dated source. Annual revenue, revenue growth, net income and margin come from each company's own 10-K, in US dollars, and each row shows that fiscal year. Revenue growth compares the fiscal year with the prior year stated in the same 10-K. Net income is the full year amount attributable to the company, or available to common stockholders where the filing states only that, or consolidated net income. Each row names its basis. Trailing P/E reads "Not meaningful" when the dated trailing diluted EPS is a loss or zero. An operating margin appears only when the filing states both the operating income and the revenue for the same year.
Sources: SEC filings, Gloria daily closes and CoinGecko. Oldest record refresh: Oct 29, 2026, 1:52 PM EDT. Refresh is not a price or filing date. Each row shows its price date and its annual fiscal period. Peers use industry code and company size, or editorial selection. Market cap multiplies that row price by the company share total the latest SEC filing states for every share class together. Trailing P/E divides it by trailing diluted earnings from SEC filings. Rolled earnings per share are approximate because share counts can change between periods. Both appear only when the SEC data carries its date, so they are estimates at one price date, not synchronized filing valuations. Not investment advice.
Token vs underlying stock
Current comparison for NVDA. Historical observations may postdate this article.
Split-adjusted regular-session stock closes from the existing Gloria shared history, paired only with an observed token price within 45 minutes of 16:00 New York time. Up to 60 matched sessions. No interpolation or missing-date fill. Weekends and known early closes are omitted. Token units are not adjusted for issuer multipliers or dividend treatment. This compares quoted prices, not fair value, executable premiums or arbitrage returns. Solid line: token. Dashed line: stock. Exact quote times and values appear below. Historical observations. Retrieval refers to the token source. Token quote times use UTC. The fixed cohort shows its oldest member fetch.
Nvidia token vs Nvidia stock: exact source values
Date (UTC)
Token (USD)
Stock close (USD)
Token quote (UTC)
2026-08-06
219.15
218.99
2026-08-06 20:00
2026-08-07
223.93
223.96
2026-08-07 20:00
2026-08-10
217.66
217.55
2026-08-10 20:00
2026-08-11
217.53
217.50
2026-08-11 20:00
2026-08-12
224.12
224.09
2026-08-12 20:00
2026-08-13
225.42
225.30
2026-08-13 20:00
2026-08-14
225.34
225.16
2026-08-14 20:00
2026-08-17
225.13
225.01
2026-08-17 20:00
2026-08-18
219.70
219.74
2026-08-18 20:00
2026-08-19
217.76
217.56
2026-08-19 20:00
2026-08-20
216.79
216.85
2026-08-20 20:00
2026-08-21
214.85
214.72
2026-08-21 20:00
2026-08-24
208.75
208.48
2026-08-24 20:00
2026-08-25
213.16
213.05
2026-08-25 20:00
2026-08-26
210.06
209.66
2026-08-26 20:00
2026-08-27
227.96
227.98
2026-08-27 20:00
2026-08-28
217.74
217.55
2026-08-28 20:00
2026-08-31
220.91
220.78
2026-08-31 20:00
2026-09-01
217.58
217.44
2026-09-01 20:00
2026-09-02
224.46
224.41
2026-09-02 20:00
2026-09-03
228.90
228.45
2026-09-03 20:00
2026-09-04
230.35
230.36
2026-09-04 20:00
2026-09-08
225.69
225.73
2026-09-08 20:00
2026-09-09
223.89
223.67
2026-09-09 20:00
2026-09-10
218.70
218.36
2026-09-10 20:00
2026-09-11
218.92
218.29
2026-09-11 20:00
2026-09-14
211.47
210.96
2026-09-14 20:00
2026-09-15
212.34
212.17
2026-09-15 20:00
2026-09-16
214.25
213.90
2026-09-16 20:00
2026-09-17
219.68
219.34
2026-09-17 20:00
2026-09-18
222.24
222.27
2026-09-18 20:00
2026-09-21
227.69
227.38
2026-09-21 20:00
2026-09-22
229.20
228.87
2026-09-22 20:00
2026-09-23
225.44
225.51
2026-09-23 20:00
2026-09-24
224.87
224.58
2026-09-24 20:00
2026-09-25
225.29
225.07
2026-09-25 20:00
2026-09-28
228.97
228.86
2026-09-28 20:00
2026-09-29
227.95
227.21
2026-09-29 20:00
2026-09-30
229.85
228.38
2026-09-30 20:00
2026-10-01
231.18
230.86
2026-10-01 20:00
2026-10-02
234.38
233.95
2026-10-02 20:00
2026-10-05
239.30
238.90
2026-10-05 20:00
2026-10-06
239.71
239.24
2026-10-06 20:00
2026-10-07
237.80
237.47
2026-10-07 20:00
2026-10-08
230.81
230.48
2026-10-08 20:00
2026-10-09
229.70
229.28
2026-10-09 20:00
2026-10-12
226.87
226.32
2026-10-12 20:00
2026-10-13
228.73
228.52
2026-10-13 20:00
2026-10-14
221.56
221.30
2026-10-14 20:00
2026-10-15
217.48
217.23
2026-10-15 20:00
2026-10-16
214.56
214.13
2026-10-16 20:00
2026-10-19
217.41
217.09
2026-10-19 20:00
2026-10-20
216.69
216.47
2026-10-20 20:00
2026-10-21
222.20
221.97
2026-10-21 20:00
2026-10-22
212.42
212.21
2026-10-22 20:00
2026-10-23
211.27
210.96
2026-10-23 20:00
2026-10-26
216.15
216.00
2026-10-26 20:00
2026-10-27
218.06
217.94
2026-10-27 20:00
2026-10-28
215.40
215.38
2026-10-28 20:00
2026-10-29
213.57
213.66
2026-10-29 20:00
Stock history: Gloria · Retrieved Oct 30, 00:32 UTC. Token history: CoinGecko NVDAx.
Quoted token and share units can have different rights, multipliers and dividend treatment. This is not an executable premium or arbitrage signal.
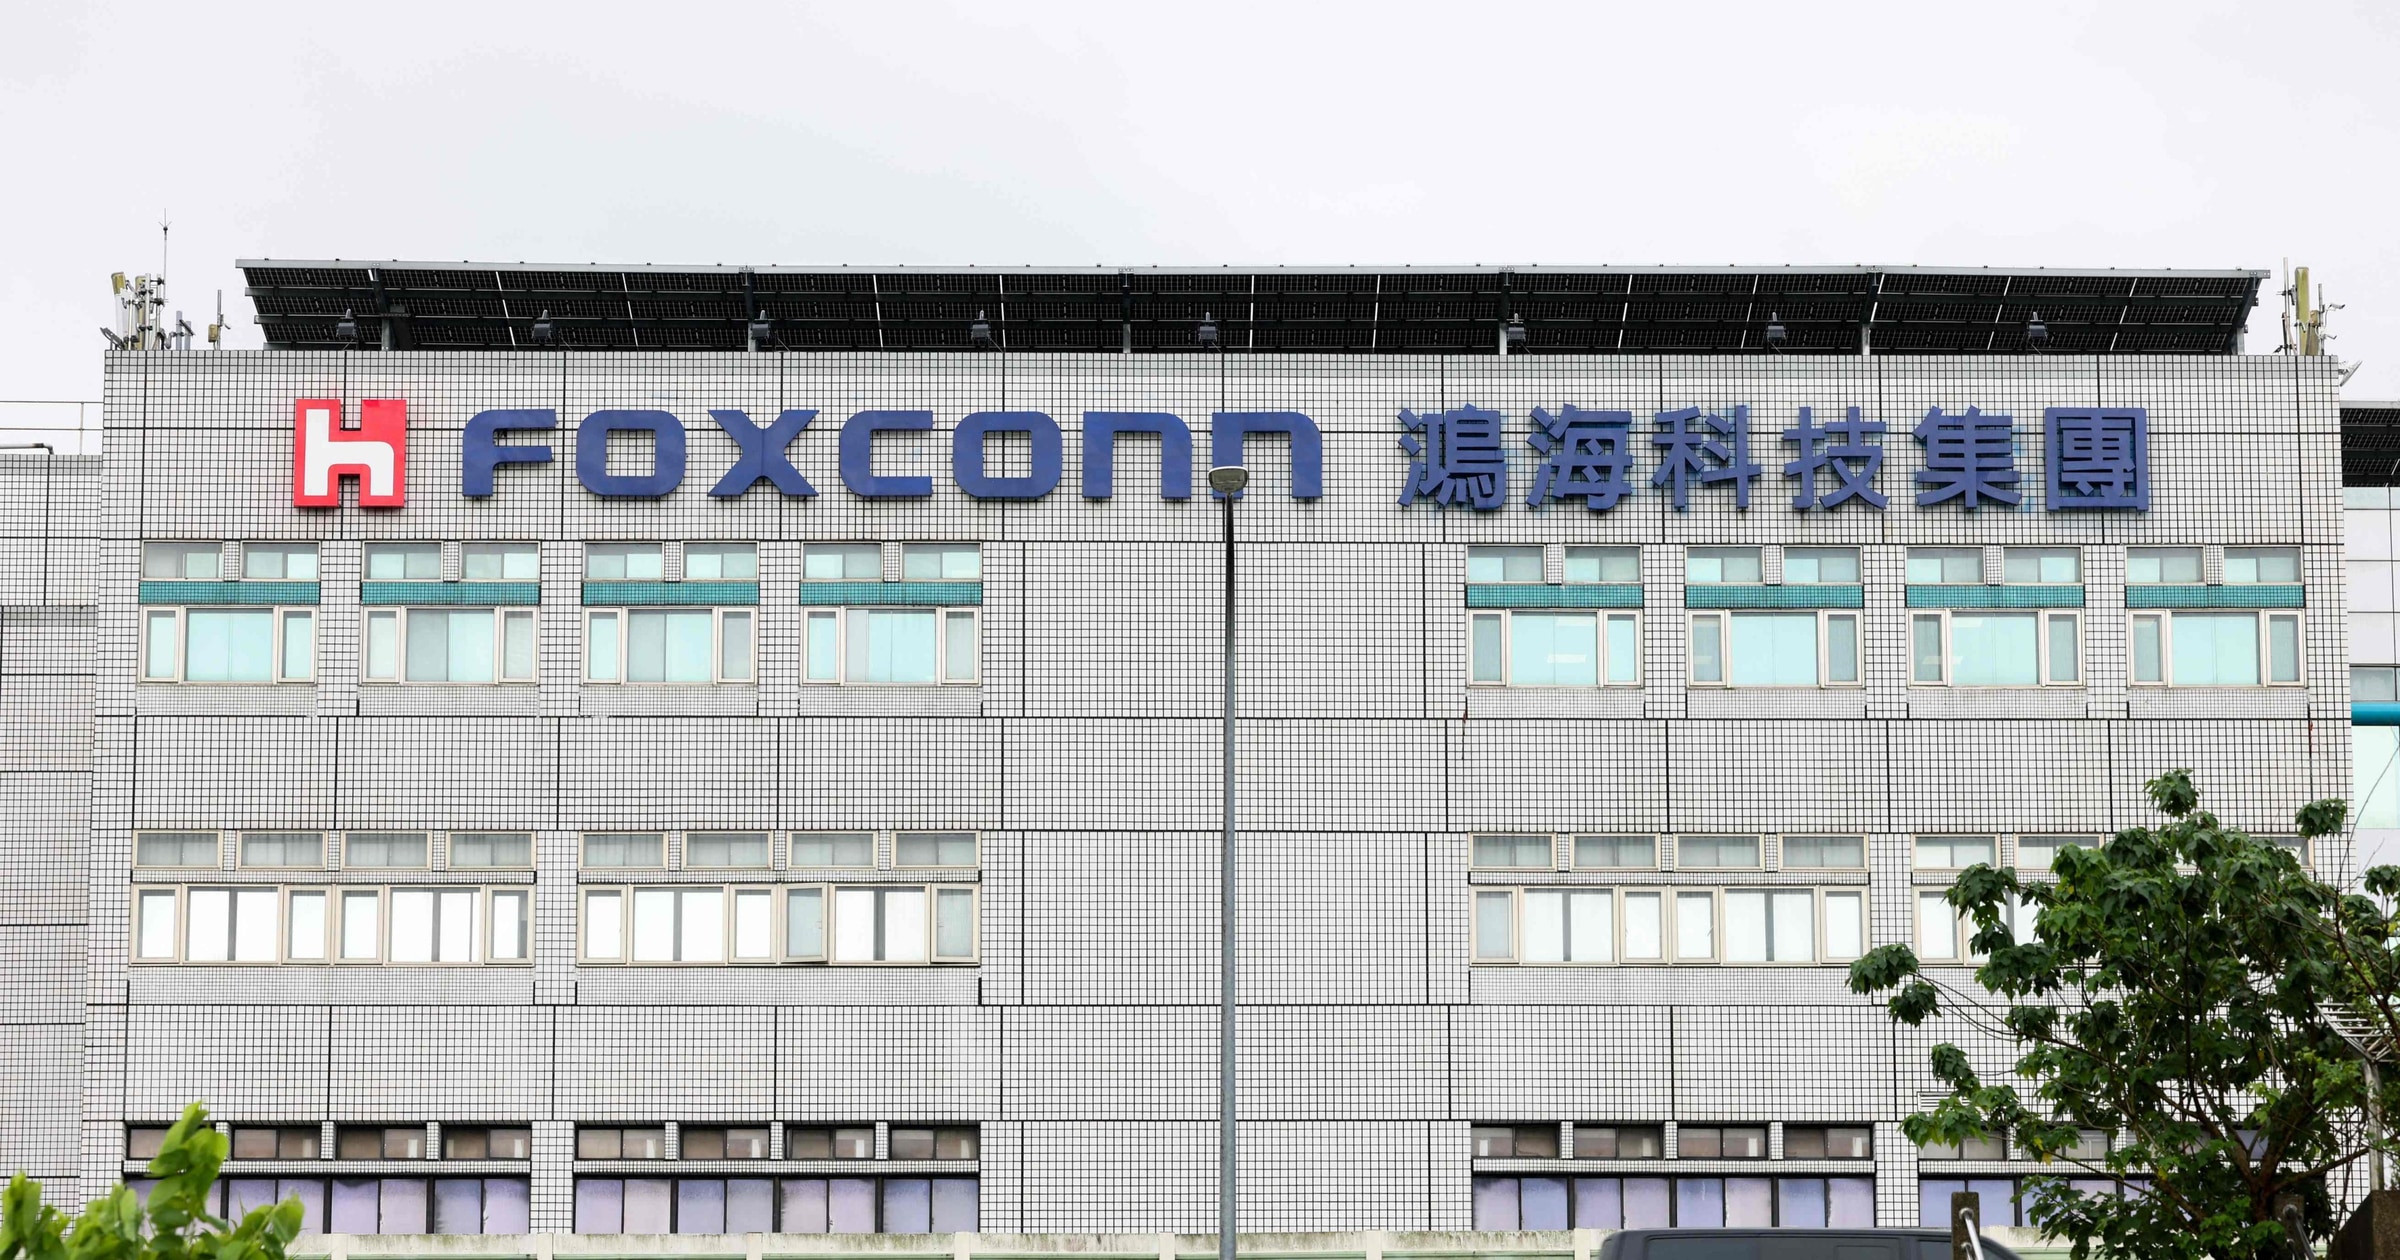
Hon Hai Precision Industry Co., also known as Foxconn, has reported a remarkable 54.2% increase in its monthly sales, reaching NT$946.5 billion. This marks the highest monthly sales level on record for the Taiwanese electronics manufacturer. The growth is attributed to strong demand in its cloud and networking division, which includes AI servers, and is fueled by significant orders from clients such as Nvidia. This development suggests a sustained demand in the global AI infrastructure sector, potentially impacting Nvidia’s market position positively.
Key Takeaways
Hon Hai’s sales surge appears consistent with increasing demand for AI infrastructure, particularly benefiting Nvidia.
Market pricing suggests a supportive outlook for Nvidia, with increased odds of it becoming the largest company by market cap by August 31.
Observers note a significant move in the market, with a recent rise in YES outcomes for Nvidia’s market cap position.
What to Watch
Market participants will monitor further developments in AI infrastructure demand and its impact on Nvidia’s market position. Key indicators include Nvidia’s upcoming earnings report and any large new orders in the AI sector. Additionally, shifts in global economic conditions or changes in tech industry dynamics could influence Nvidia’s standing as the potential largest company by market cap at the end of August.
Disclosure: This article was edited by Estefano Gomez. For more information on how we create and review content, see our Editorial Policy.