+17.8% (FY ended 2026-06-30 vs FY ended 2025-06-30) 10-K
Annual net income
133,749,000,000 USD (FY ended 2026-06-30, attributable to the company) 10-K
Annual operating margin
46.8% (FY ended 2026-06-30)
Forward P/E
Unavailable: no dated forecast source
Gloria daily close for session Oct 27, 2026. Market cap and trailing P/E use this close with the SEC share total and trailing diluted earnings, each dated next to its figure. Annual revenue, revenue growth, net income and margin show their own fiscal period and link the 10-K. Current context may postdate this article.
−162,502,000FY ended 2026-01-31, attributable to the company · 10-K
−6.1%FY ended 2026-01-31
Missing figures stay unavailable. Forward P/E requires a dated source. Annual revenue, revenue growth, net income and margin come from each company's own 10-K, in US dollars, and each row shows that fiscal year. Revenue growth compares the fiscal year with the prior year stated in the same 10-K. Net income is the full year amount attributable to the company, or available to common stockholders where the filing states only that, or consolidated net income. Each row names its basis. Trailing P/E reads "Not meaningful" when the dated trailing diluted EPS is a loss or zero. An operating margin appears only when the filing states both the operating income and the revenue for the same year.
Sources: SEC filings, Gloria daily closes and CoinGecko. Oldest record refresh: Oct 28, 2026, 5:41 PM EDT. Refresh is not a price or filing date. Each row shows its price date and its annual fiscal period. Peers use industry code and company size, or editorial selection. Market cap multiplies that row price by the company share total the latest SEC filing states for every share class together. Trailing P/E divides it by trailing diluted earnings from SEC filings. Rolled earnings per share are approximate because share counts can change between periods. Both appear only when the SEC data carries its date, so they are estimates at one price date, not synchronized filing valuations. Not investment advice.
Token vs underlying stock
Current comparison for MSFT. Historical observations may postdate this article.
Split-adjusted regular-session stock closes from the existing Gloria shared history, paired only with an observed token price within 45 minutes of 16:00 New York time. Up to 60 matched sessions. No interpolation or missing-date fill. Weekends and known early closes are omitted. Token units are not adjusted for issuer multipliers or dividend treatment. This compares quoted prices, not fair value, executable premiums or arbitrage returns. Solid line: token. Dashed line: stock. Exact quote times and values appear below. Historical observations. Retrieval refers to the token source. Token quote times use UTC. The fixed cohort shows its oldest member fetch.
Microsoft token vs Microsoft stock: exact source values
Date (UTC)
Token (USD)
Stock close (USD)
Token quote (UTC)
2026-08-04
499.08
492.81
2026-08-04 20:00
2026-08-05
484.73
487.46
2026-08-05 20:00
2026-08-06
498.48
499.86
2026-08-06 20:00
2026-08-07
501.35
499.99
2026-08-07 20:00
2026-08-10
507.81
506.06
2026-08-10 20:00
2026-08-11
503.83
503.81
2026-08-11 20:00
2026-08-12
493.50
492.43
2026-08-12 20:00
2026-08-13
494.66
496.88
2026-08-13 20:00
2026-08-14
496.96
495.40
2026-08-14 20:00
2026-08-17
481.91
480.35
2026-08-17 20:00
2026-08-18
482.93
481.63
2026-08-18 20:00
2026-08-19
484.48
484.31
2026-08-19 20:00
2026-08-20
482.95
481.15
2026-08-20 20:00
2026-08-21
485.28
483.24
2026-08-21 20:00
2026-08-24
489.80
487.31
2026-08-24 20:00
2026-08-25
491.36
491.71
2026-08-25 20:00
2026-08-26
498.86
496.37
2026-08-26 20:00
2026-08-27
506.15
505.06
2026-08-27 20:00
2026-08-28
514.87
513.53
2026-08-28 20:00
2026-08-31
510.07
507.29
2026-08-31 20:00
2026-09-01
503.61
501.02
2026-09-01 20:00
2026-09-02
497.76
496.82
2026-09-02 20:00
2026-09-03
512.63
510.12
2026-09-03 20:00
2026-09-04
500.58
499.70
2026-09-04 20:00
2026-09-08
493.27
493.95
2026-09-08 20:00
2026-09-09
491.69
491.65
2026-09-09 20:00
2026-09-10
493.07
492.44
2026-09-10 20:00
2026-09-11
498.52
495.63
2026-09-11 20:00
2026-09-14
508.54
505.41
2026-09-14 20:00
2026-09-15
498.86
497.12
2026-09-15 20:00
2026-09-16
494.48
490.30
2026-09-16 20:00
2026-09-17
500.28
497.75
2026-09-17 20:00
2026-09-18
496.33
493.78
2026-09-18 20:00
2026-09-21
503.22
501.61
2026-09-21 20:00
2026-09-22
501.25
498.00
2026-09-22 20:00
2026-09-23
503.06
500.59
2026-09-23 20:00
2026-09-24
501.07
497.93
2026-09-24 20:00
2026-09-25
518.98
516.17
2026-09-25 20:00
2026-09-28
511.70
509.22
2026-09-28 20:00
2026-09-29
512.06
508.96
2026-09-29 20:00
2026-09-30
515.27
512.90
2026-09-30 20:00
2026-10-01
516.84
512.80
2026-10-01 20:00
2026-10-02
519.95
517.53
2026-10-02 20:00
2026-10-05
527.35
525.18
2026-10-05 20:00
2026-10-06
532.35
529.30
2026-10-06 20:00
2026-10-07
532.01
529.76
2026-10-07 20:00
2026-10-08
525.93
522.61
2026-10-08 20:00
2026-10-09
537.45
535.07
2026-10-09 20:00
2026-10-12
543.48
541.15
2026-10-12 20:00
2026-10-13
546.06
543.45
2026-10-13 20:00
2026-10-14
535.70
533.69
2026-10-14 20:00
2026-10-15
542.43
539.44
2026-10-15 20:00
2026-10-16
531.87
529.05
2026-10-16 20:00
2026-10-19
535.69
533.52
2026-10-19 20:00
2026-10-20
535.30
531.87
2026-10-20 20:00
2026-10-21
535.87
532.95
2026-10-21 20:00
2026-10-22
524.11
521.08
2026-10-22 20:00
2026-10-23
525.75
524.51
2026-10-23 20:00
2026-10-26
534.07
532.60
2026-10-26 20:00
2026-10-27
533.36
531.33
2026-10-27 20:00
Stock history: Gloria · Retrieved Oct 28, 00:31 UTC. Token history: CoinGecko MSFTx.
Quoted token and share units can have different rights, multipliers and dividend treatment. This is not an executable premium or arbitrage signal.
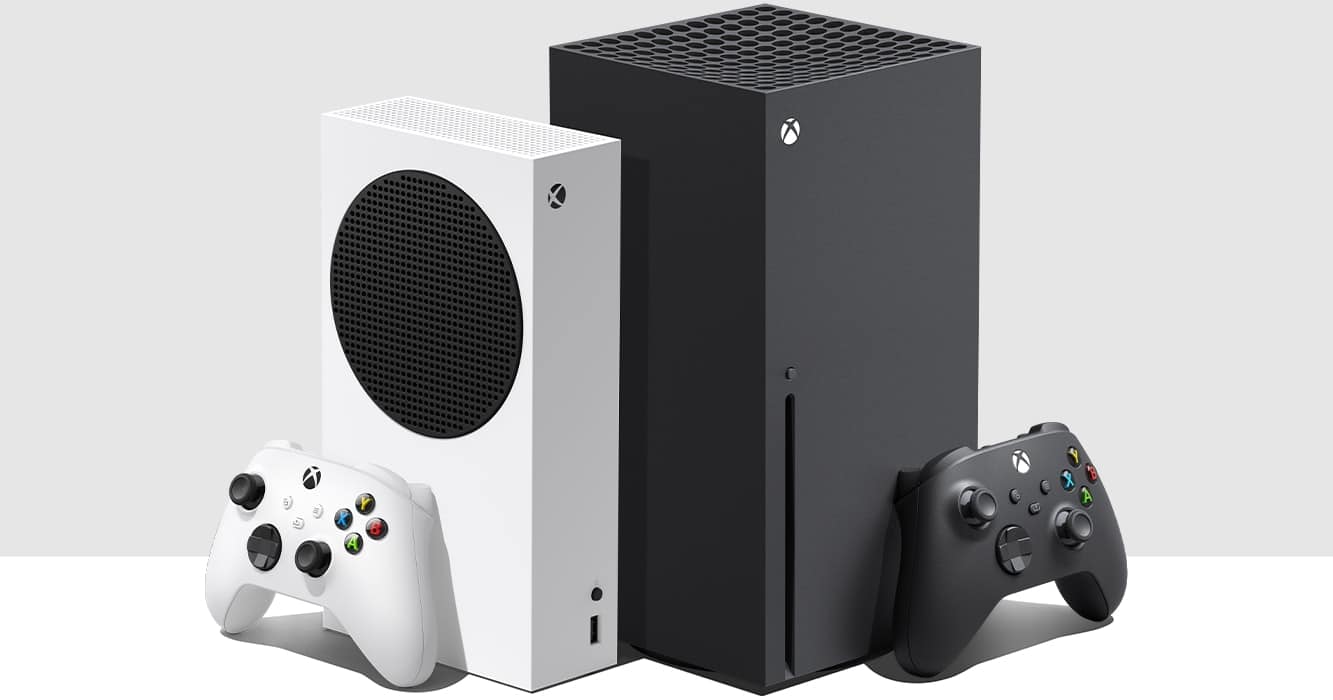
Microsoft just slapped another $100 to $150 on every Xbox Series X|S console, effective August 1. The base 512GB models jump by $100, while higher-storage configurations climb by as much as $150, pushing certain Series X setups close to $800.
The company is also killing the 2TB Xbox model entirely. This is the third time Microsoft has hiked Xbox prices since May 2025, and the explanation is always the same: memory and storage components are becoming brutally expensive.
The AI appetite eating your electronics budget
Storage and memory component costs have increased more than 2.5 times since 2024. And the situation is expected to get worse, with costs projected to double again by fall 2027.
The culprit has a name: high-bandwidth memory, or HBM. Manufacturers like Samsung and Micron have been aggressively shifting production capacity toward these AI-grade chips, which fetch premium prices from data center operators. Micron has reportedly exited parts of its consumer business entirely to focus on data center clients.
OpenAI’s Stargate project alone is estimated to consume up to 40% of global DRAM output. Every Xbox, MacBook, smartphone, and tablet has to compete for what’s left.
Microsoft isn’t suffering alone. On the same day, June 25, Apple announced price increases of $100 to $300 across multiple MacBook and iPad models. Some Apple devices saw price jumps of nearly 20%. Apple cited the exact same reason: surging demand for memory and storage chips driven by AI infrastructure expansion.
AI, tech, and the markets they move—in one daily briefing.
Daily. Free. Join 34,000+ readers across crypto, finance, and policy.
Even with three rounds of price hikes in just over a year, Microsoft is reportedly still losing hundreds of dollars on every console sold at current prices. Discontinuing the 2TB model makes sense through that lens. Higher-capacity storage means more of those increasingly expensive chips per unit.
The global DRAM and NAND markets have been critically destabilized by AI-related demand since 2025, creating a supply squeeze for consumer electronics makers. Manufacturers are making rational economic choices by prioritizing their highest-margin customers, which happen to be AI companies willing to pay almost any price for memory chips.
What this means for investors
Microsoft and Apple chose price hikes. But an Xbox approaching $800 is competing with gaming PCs. A MacBook pushing well past $2,000 starts losing price-sensitive buyers. The research suggests these trends will continue through at least 2027.
The companies to watch are the chip manufacturers themselves. Samsung, Micron, and other major memory producers are making strategic bets on AI infrastructure over consumer electronics. Those capacity allocation decisions will determine how severe the consumer squeeze gets.
For crypto and decentralized AI projects, any project that requires significant hardware deployment faces the same component cost pressures as Microsoft and Apple. The memory chip bottleneck doesn’t care whether your data center is run by OpenAI or a decentralized network of node operators.
Disclosure: This article was edited by Editorial Team. For more information on how we create and review content, see our Editorial Policy.